Tamadoge Price Prediction – June 15
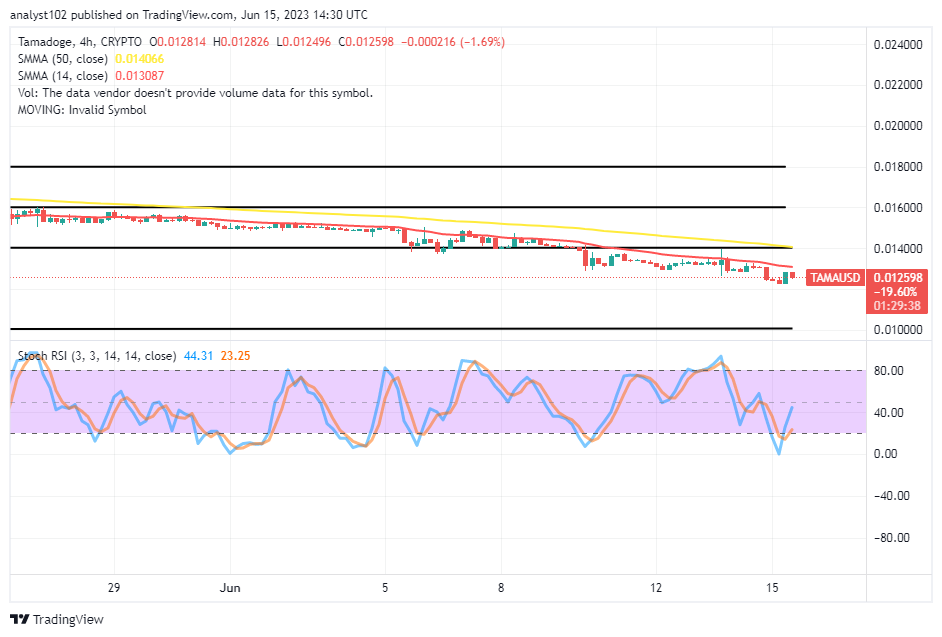
Generally, the transaction activities in the TAMA/USD market showcases that the crypto-economic price garners catalysts, breaking supports in a slow manner in accordance at a given degree of the trade responsiveness. On the path of that bargain outcome, buyers and investors would have to be patiently awaiting a rebounding situation that will potentially regenerate forces to recoup higher points in the manner of sequential orders afterward. At the moment of this technical piece, price trades between $0.012496 and $0.012598 value lines at an average negative percentage rate of 1.69.
TAMA/USD Market
Key Levels
Resistance levels: $0.01500, $0.01600, $0.01700
Support levels: $0.01200, $0.01100, $0.01000
TAMA/USD – 4-hour Chart
It has happened on the TAMA/USD 4-hour chart that the crypto-economic price garners catalysts, breaking supports underneath the trend lines of the SMAs. In an actual trading position, the 14-day SMA indicator has tightly and briefly bent southward, placing at $0.013087 point underneath the $0.014066 value line of the 50-day SMA indicator. The Stochastic Oscillators have swerved briefly from the oversold region to 23.25 and 44.31 levels. But, a smaller 4-hour trading candlestick currently in the making denotes a falling moment through the path of its nascent penultimate.
Could buyers get better prices if the TAMA/USD SMAs break northward before it’s time to buy in?
Tamadoge is an emerging crypto-economic market bound to experience the typical mood of trending nature as the price is garnering catalysts, breaking supports on a lighter mode ahead of sessions to be characterized by bounces aftermath. In light of the impending bullish running cycle, there is still a window of opportunity for buying that is making it back into investment portfolios. In the interim, the support line near $0.01200 will be the next target for buyers to execute a more decent buying position order. 
TAMA/USD 1-hour chart
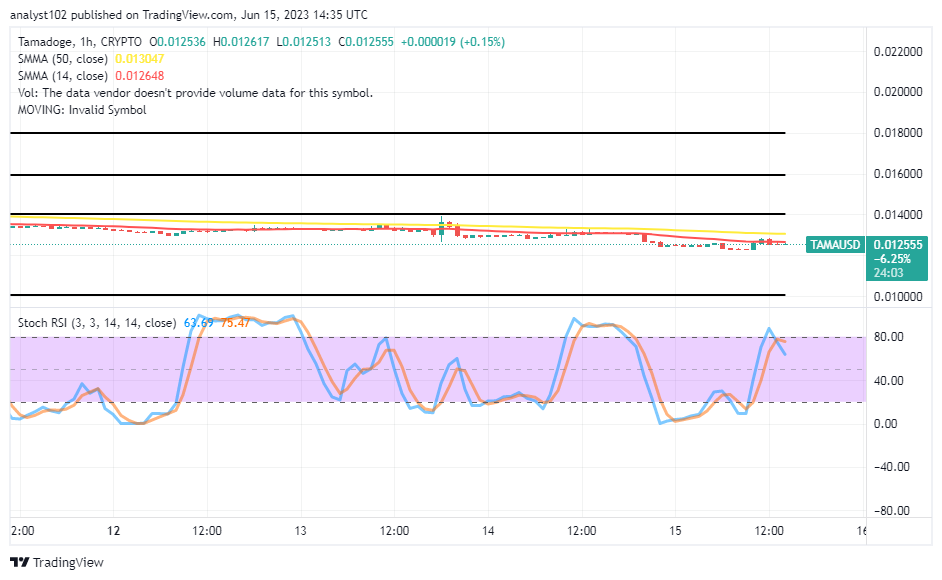
The 1-hour chart depicts that the crypto-economic price garners catalysts, breaking supports systemically and closely around the trend line of the smaller SMA. It appears that selling force leftovers are still attentively making an impact in the positions of bulls in the market to cause unnecessary fears. The 14-day SMA indicator is closely underneath the 50-day SMA indicator. The Stochastic Oscillators have northbound sprung to a position slightly southbound around 80 to 75.47 and 63.69 points. Our trade verdict technicality, based on the outlook of the short-term run, denotes that buyers should exercise patience toward having a repositioning condition of the Oscillators in lower range zones before buying back the dipping moves.
In a month, 55.5K participants (and growing) compete to take the top spot on the leaderboards every week!
55.5K players a month (and rising) are battling it out to claim the top spot on the leaderboards every week!
— TAMADOGE (@Tamadogecoin) June 15, 2023
Go for glory, Tama Army 👉 https://t.co/IWYl78Y8K6 pic.twitter.com/pcibYmFrKK
Do you want a coin that would 100X in the next few months? That is Tamadoge. Buy TAMA today
Note: Forexschoolonline.com is not a financial advisor. Do your research before investing your funds in any financial asset or presented product or event. We are not responsible for your investing results.


Leave a Reply