Tamadoge Price Prediction – August 18
Over time, there have been predominant free fall-offs in most of all crypto economies, and the Tamadoge market isn’t exempt, as the price finds support around the trade line of $0.006000 against the US coin and makes a spring from the value line to trade around the spot of $0.007000.
At this moment in this technical piece, buyers are at a positive point of around $0.006888, keeping a minute percentage rate of 0.41. Technically, long-position pushers currently have to contend with the breaking of a barrier built around the line of $0.007000 sustainably to establish a genuine commencement of the rising trend of the valuation of cryptocurrency business activity. Nevertheless, investors should keep on buying the dips approach.
TAMA/USD Market
Key Levels
Resistance levels: $0.007500, $0.008000, $0.008500
Support levels: $0.006000, $0.005500, $0.005000
TAMA/USD Medium-term Chart
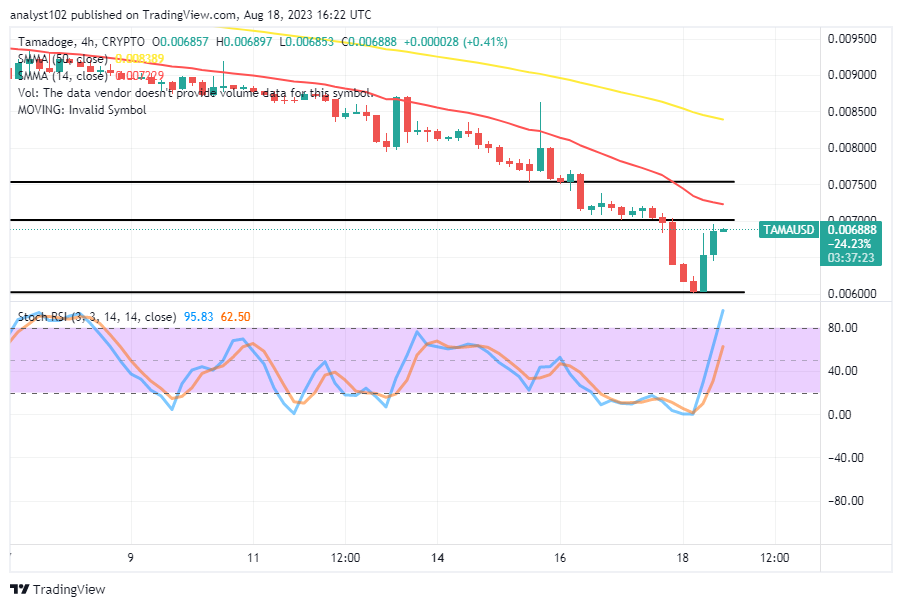
The TAMA/USD medium-term chart showcases the crypto market finding support around the level of $0.006000 as it makes a spring from it in the last few hours.
Following that circumstance, the reading outlook of the stochastic oscillators suggests the volatility index of the rises has nearly reached a conclusion point to portend a pit stop at the time of this compilation of psychological analytics. Underneath the 50-day SMA indicator’s $0.008389 value, the 14-day SMA indicator is at a level of $0.007229. And all that denotes that the crypto is still trading under falling setups.
As TAMA still trades under falling forces against the US dollar, should investors relax their efforts to get more positions?
It connotes signs of advantages for the TAMA/USD market investors to get more order positions the more the situation shows that there are downward motions, given that the crypto-economic price finds support around $0.006000 and makes a visible spring from it.
The northward springing motion has currently significantly outstretched its velocity to the point where bears could regain momentum to plunge back against some of the positive points toward the baseline of $0.006000 if buyers tend to become lax in their recovery moving bid. Investors should allow their ever-open positions to run through some months ahead into the following year and the year after to see how the presumed enormous profits will be generated afterward, as we have been nurturing the idea of buying and holding. 
TAMA/USD Short-term chart
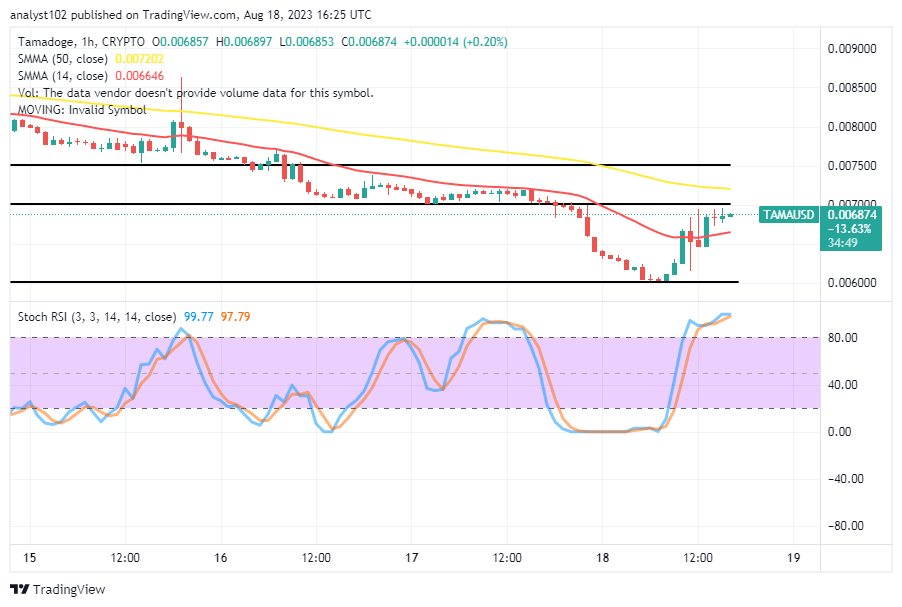
The TAMA/USD short-term chart reveals the crypto-economic price finds support and makes a spring from the value line of $0.006000.
The 14-day SMA trend line is at $0.006646, behind the $0.007202 value line of the 50-day SMA trend line. A line of bullish candlesticks has formed to break through the smaller moving average’s point. The stochastic oscillators have penetrated the overbought region to signal that forces to forcibly push northward are rated between 97.79 and 9977 values. That suggests long position takers have to add more muscles to their muscles to survive against any risk of reversing the upward climb now obtained at the market in no time.
Be set to be driven into the world of Tamadoge as TamaTom presents you the latest from the Tamaverse:
🔥 #Tama Army! 🔥
— TAMADOGE (@Tamadogecoin) August 18, 2023
Get ready to be whiskered away into the world of Tamadoge as TamaTom brings you the latest from the Tamaverse:
🎉 Tamadoge Arena on iOS
🔥 Burn, Tama, Burn
🐶 Tamagotchi teasers#memecoin #play2earn #Crypto pic.twitter.com/yzsgUs05hS
Do you want a coin that would 100X in the next few months? That is Tamadoge. Buy TAMA today
Note: Forexschoolonline.com is not a financial advisor. Do your research before investing your funds in any financial asset or presented product or event. We are not responsible for your investing results.


Leave a Reply