Tamadoge Price Prediction, January 17
Prolongation of the method that would lead to resumption of northward rising forces has been kept in the market operations that involve Tamadoge versus the economic valuation of the US coin, as it has been currently observed that the crypto’s price is decreasing slightly, preparing for explosions in no time.
As evidenced, market movements seem to continue to trend downward, providing fewer opportunities for profitable short-term entry. Due to the transactional line’s actual technicalities, investors who are steadfast in their belief that the cryptocurrency economy will succeed have more room. Our conclusion is still that maintaining dip purchasing strategies should be adhered to.
TAMA/USD Market
Key Levels
Resistance levels: $0.0080, $0.0085, $0.0090
Support levels: $0.0070, $0.0065, $0.0060
TAMA/USD Medium-term Chart
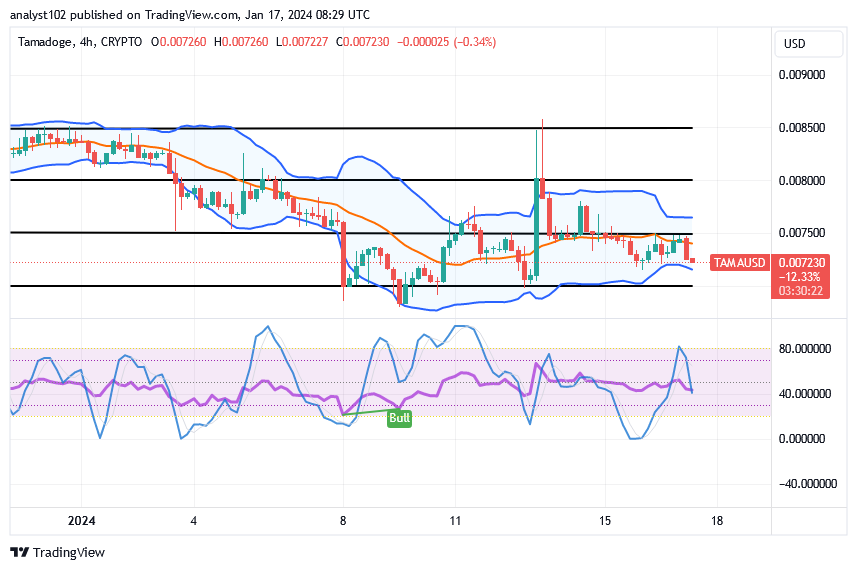
The TAMA/USD medium-term chart reveals that the crypto-economic trade decreases, preparing for explosions.
It is necessary to make references to what the trade situation is going to be like on the daily chart, as it is currently depicted on it that there might still be room for further delay to cause some lighter lows. The Bollinger Band has been made to cost between $0.00800 and $0.00700. The stochastic oscillators are in a mode of being slightly southbound.
Should the TAMA/USD market sellers participate in more active falls in that order if they occur, given that the signs are pointing to declines?
It is highly not recommended that bears dwell on any furtherance of declines as the TAMA/USD market decreases, readying for explosions.
As things stand, the lower Bollinger Band trend line has continued to play a crucial role in preventing the gradual emergence of more decreases in the operations that follow. It is strongly advised to use an investment trading strategy in conjunction with any efforts to drive the cryptocurrency industry’s valuation down to the US dollar. On the basis of such sentiment, sellers run the risk of quickly finding themselves in a tight spot.
TAMA/USD short-term chart
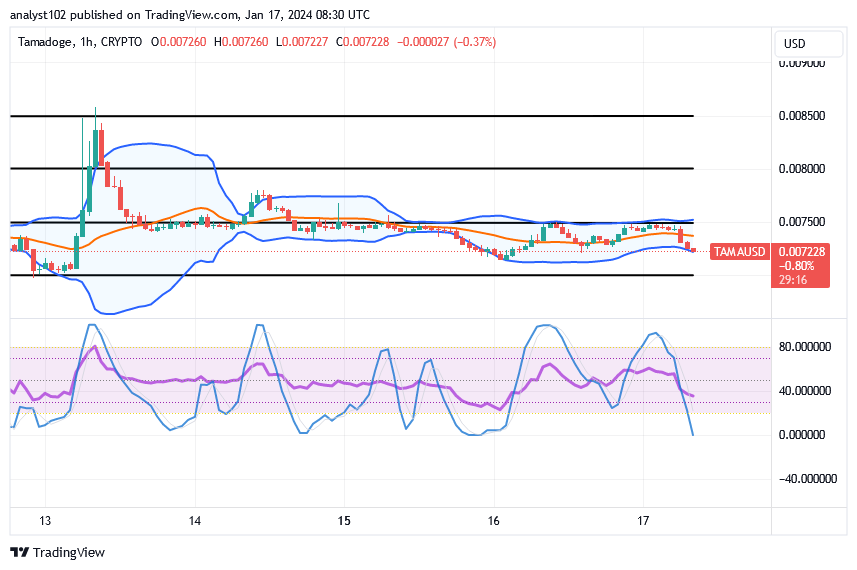
The TAMA/USD short-term chart reveals that the crypto-economic trade decreases, readying for explosions as it is trading around the lower end of the Bollinger Bands.
The stochastic oscillators have entered the oversold area after crossing southward, suggesting that selling impulses are about to be thwarted as a bullish candlestick emerges. The Bollinger Bands are positioned eastward to indicate that the $0.0075 line is currently the main area of resistance. In the long run of the market, the trading line of $0.00700 continues to be the biggest obstacle for short-position takers.
Enter the world of Tamadoge games and see how much money you can make with TAMA!
Play, earn, stake, and repeat to experience an unending cycle of fun and benefits.
Dive into the world of Tamadoge games and watch your $TAMA earnings grow!
— TAMADOGE (@Tamadogecoin) January 16, 2024
Play, earn, stake, and repeat for an endless cycle of excitement and rewards 🎉
Check out all of our games on mobile now 👇
📱 Android: https://t.co/D4TjX7gTFl
📱 iOS: https://t.co/0fjJapf5oA pic.twitter.com/7QrRJ2V98s
Do you want a coin that would 100X in the next few months? That is Tamadoge. Buy TAMA today
Note:Forexschoolonline.com is not a financial advisor. Do your research before investing your funds in any financial asset or presented product or event. We are not responsible for your investing results.


Leave a Reply