Tamadoge Price Prediction – June 16
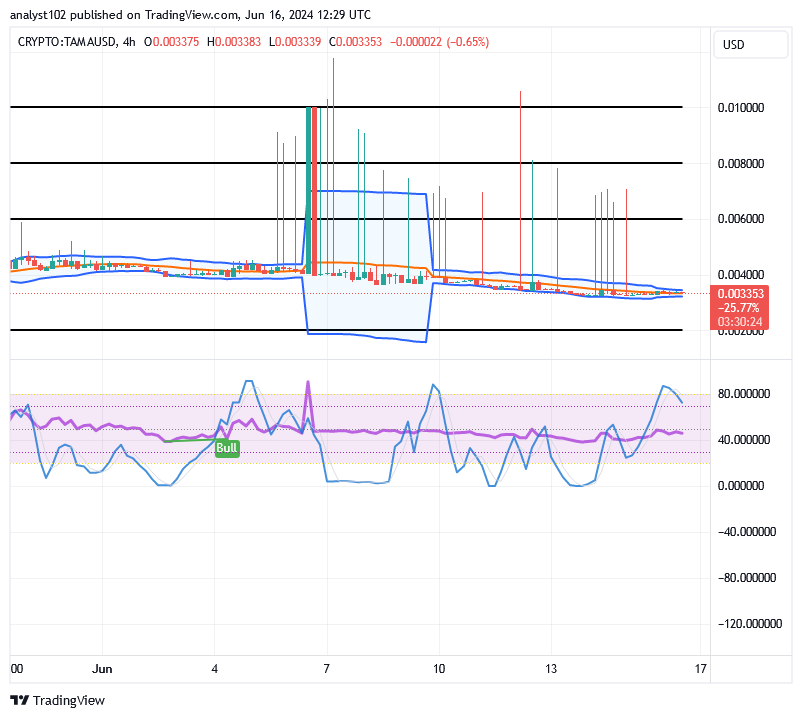
Price actions that have characterized movements have been continually finding a footstep around the threshold of $0.004, given that the TAMA/USD price currently extends base, breathing rise inputs.
Until buyers need to add more robust muscles to persist above those places where sellers have been reclaiming postures around $0.01 and close below, price actions in the sideways must be replicated. As things stand, long-position pushers should exercise caution when making abrupt, reversible positive moves, with the exception of when positional values are freely stationed above the $0.006 line for an extended period of time.
TAMA/USD Market
Key Levels
Resistance levels: $0.006, $0.008, $0.01
Support levels: $0.003, $0.0025, $0.002
TAMA/USD Medium-term Chart
The TAMA/USD medium-term chart reveals that the crypto market extends base formulation around the lower Bollinger, breathing rise inputs.
The stochastic oscillators have traversed northbound to touch some areas near and into the overbought zone to denote that the market may still prolong staying around its actual trade spot of the moment. The Bollinger Bands have systemically remained tretching downward slightly in the east direction, around $0.004.
Considering that the price has recently been seen to reverse higher many times, should purchasers in the TAMA/USD market exercise further caution?
As there has been a witness of a series of corrections in the operations of TAMA/USD, long-position movers need to be cautious of not taking the market moves at considerable dip-trading zones, given that the price presently extends base, breathing rise inputs.
The lower Bollinger Band trend line must serve as the foundation for a robust and long-lasting threshold. Using that rational trade strategy as a guide, purchasers should gradually increase the number of points they currently own. Traders pursuing buy orders are probably going to make some good entrances when the market tries to turn south from the lower region of the indicator.
The TAMA/USD short-term
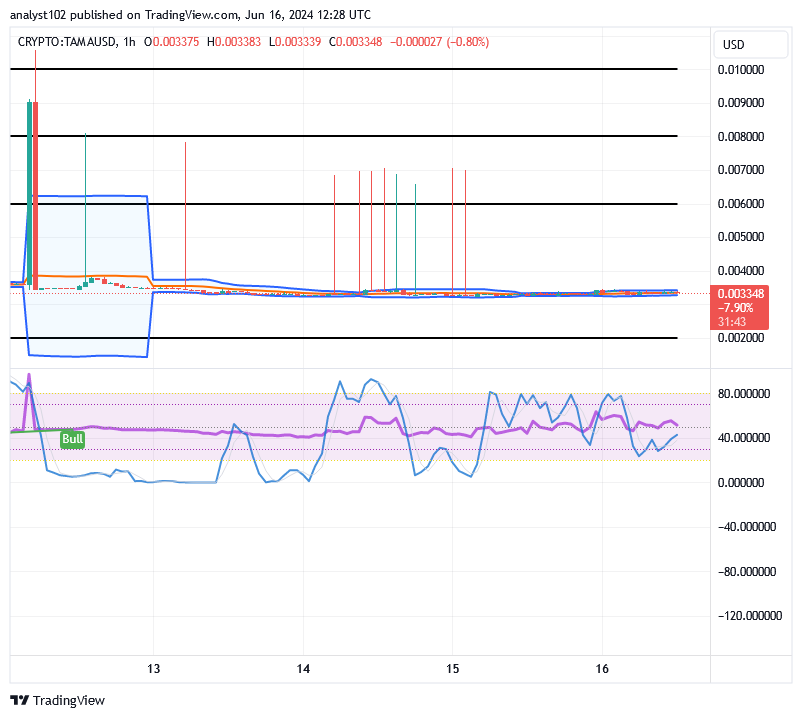
The TAMA/USD short-term chart shows that the crypto market currently extends base building, breathing rise inputs.
The stochastic oscillators have been irregularly swerving both north and south around 80 and 20. Furthermore, variation-lowering, both positive and negative, has been seen. The Bollinger Bands have been seen to incorporate candlestick shapes.
Boost the strength and agility of your virtual pet to win those games!
Get experience points, personalize your dog, and watch them develop into a champion!
Enhance your #Tamadoge gaming experience with the Pet Store! 🐕
— TAMADOGE (@Tamadogecoin) June 16, 2024
Upgrade your virtual pet’s agility and strength to ace those games! 🏆💪
Collect XP, customize your pup, and watch them grow into a champion! 🌟
Download NOW!#DogeOrNothing #CryptoGaming #Crypto pic.twitter.com/VfCbuJgYVj
Do you want a coin that would 100X in the next few months? That is Tamadoge. Buy TAMA today
Note: Forexschoolonline.com is a financial advisor. Do your research before investing your funds in any financial asset or presented product or event. We are not responsible for your investing results.


Leave a Reply