Tamadoge Price Prediction – October 19
Bulls in the emerging market have not been fearfully upheld most times above the line of $0.009000 to let more intending investors gain an advantage as the Tamadoge versus the US currency market dumps, recouping at $0.008000.
The lower Bollinger Band trend line has been the focus of intense buying and selling activity in the market. The low-value line was obtained at $0.007924 at a minute positive percentage rate of 0.88 once it was set. This suggests that position orders for long positions have been significantly rebuilding their bottoms above the $0.007500 support level.
TAMA/USD Market
Key Levels
Resistance levels: $0.008500, $0.009000, $0.009500
Support levels: $0.007500, $0.007000, $0.006500
TAMA/USD Medium-term Chart
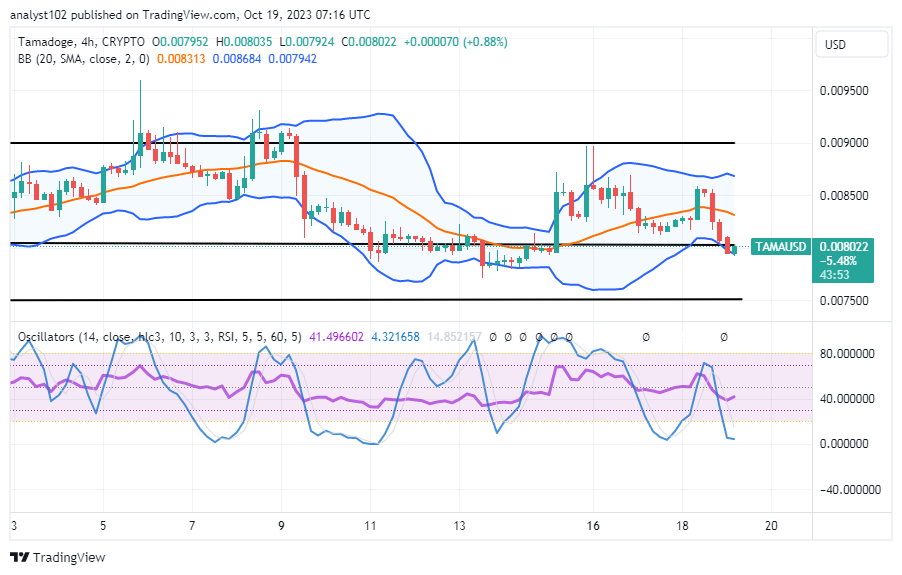
The TAMA/USD medium-term chart reveals that the crypto-economic trade dumps from around $0.008500, recouping at $0.00800.
The positional points of the Bollinger Band trend lines are secured at $0.008684, $0.008313, and $0.007984, respectively. As of the time of this write-up, a smaller bullish candlestick is in the making, featuring the lower trend line of the Bollinger band. The stochastic oscillators have southerly traversed into the oversold region, ranging from 41.496602 to 4.321658.
What trade approach is expected to be maintained by TAMA/USD traders as the price trades at $0.008022?
We are still of the opinion that buying habits should be upheld against any other sentiment, considering that the TAMA/USD market is trading under a reduction-setting outlook as the crypto-economic price dumps, recouping at $0.008.
In order to highlight the window opportunity areas for long-position takers to locate their trade base and make suitable longing entry, the horizontal lines between the points of $0.008000 and $0.007500 have been set up. The process of gathering additional data about the crypto economy must continue since, despite what indicators have suggested, there remains a strong lower trading line that is worthwhile of investment.
TAMA/USD Short-term chart
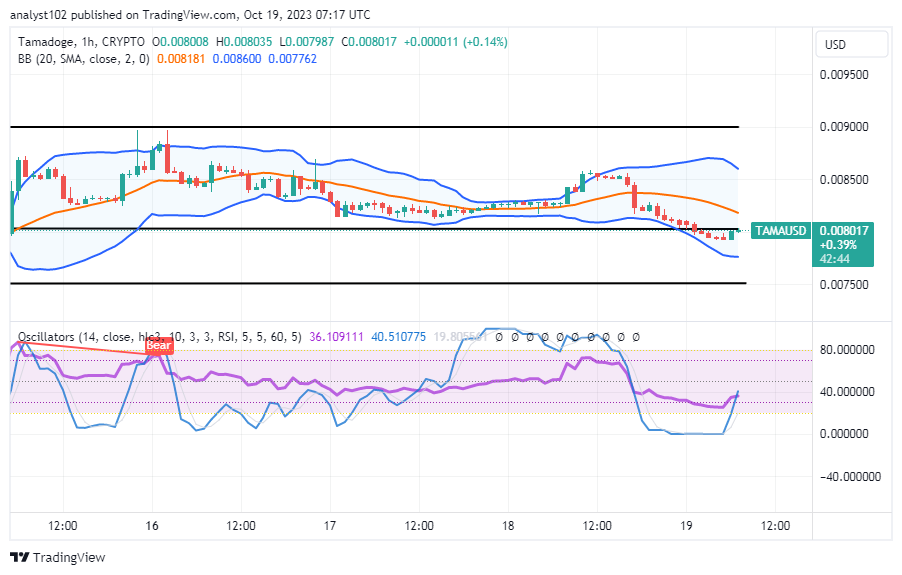
The TAMA/USD short-term chart reveals that the crypto-economic price dumps, recouping at $0.00800.
The stochastic oscillators, which are situated between 36.109111 and 40.510775, are attempting to move northward from the oversold area. On the upper side of $0.008600, $0.008181, and $0.007762, the Bollinger Band trend lines are displayed. Everything is pointing to a signal that buying actions must triumph in the TAMA/USD trade’s operations.
The Tamadoge $3000 Giveaway is currently active; be sure to participate and spread the word to your friends for a chance to win.
Tamadoge $3000 Giveaway Is Live Now, make sure to join and share with your friends to get a chance to win🏆
— TAMADOGE (@Tamadogecoin) August 9, 2022
Join Now!https://t.co/6PjmWIN9UL#Tamadoge3KGiveaway #Next100XGEMS #EnterToWin #ElonMusk
Do you want a coin that would 100X in the next few months? That is Tamadoge. Buy TAMA today
Note:Forexschoolonline.com is not a financial advisor. Do your research before investing your funds in any financial asset or presented product or event. We are not responsible for your investing results.


Leave a Reply