Tamadoge Price Prediction – April 30
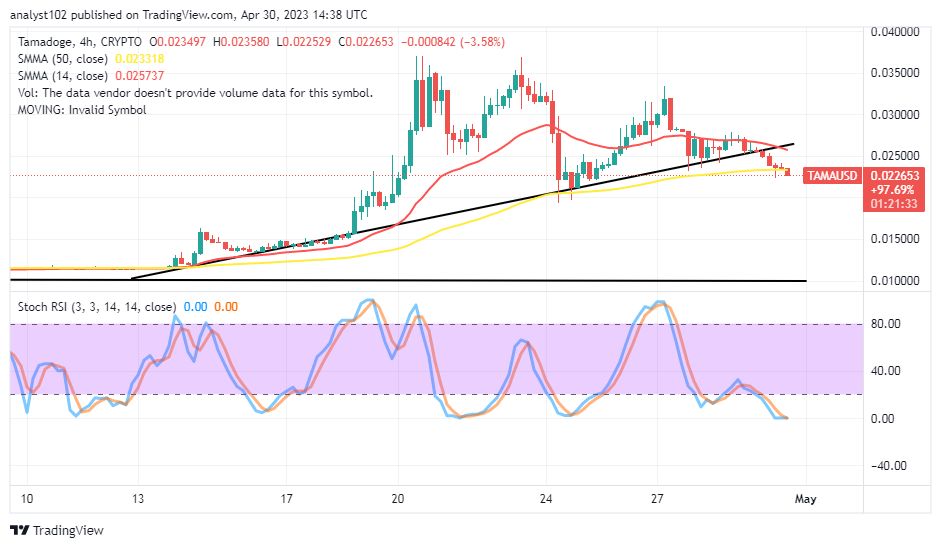
The TAMA/USD market downsizes to rebuild a bullish path, creating new rounds of buying opportunities for investors and also long-position takers. Even though the current moves do not indicate an impending end, they should maintain their positions. Over time, the price dropped to the $0.022529 line before fluctuating around $0.022653 at a negative 3.58 percentage rate.
TAMA/USD Market
Key Levels
Resistance levels: $0.02700, $0.03200, $0.03700
Support levels: $0.02000, $0.01500, $0.01000
TAMA/USD – 4-hour Chart
The TAMA/USD 4-hour chart reveals the crypto-economic price downsizes to rebuild a bullish path from within the support toward or around the $0.02000 below the trend lines of the SMAs. The 14-day SMA indicator is at $0.025737 above the $0.023318 value line of the 50-day SMA indicator. The Stochastic Oscillators are in the oversold region, showing 0.00 and 0.00 levels, suggesting that bears’ pushing efforts are in the state of maximal point.
What should investors consider in light of the recent decline in the TAMA/USD trade operation?
Investors and intending buyers should count the present situation as an opportunity to add more to their past buying positions as the crypto-economic price downsizes to rebuild a bullish path from a lower support spot. When a bullish candlestick eventually appears, it will signal the end of the cycle for the longing position. It would only be necessary to make an effort by being alert to notice when it would occur before pressing the button in that direction based on that sentiment.
On the downside of the TAMA/USD technical analysis, short-position placers shouldn’t just jump into the trending movement to scale through the possibility of getting whipsawed in no time in the habit. Sellers should be cautious about getting involved in any downturns because the fledgling crypto economy will probably see a bounce at any moment.
TAMA/USD 1-hour chart
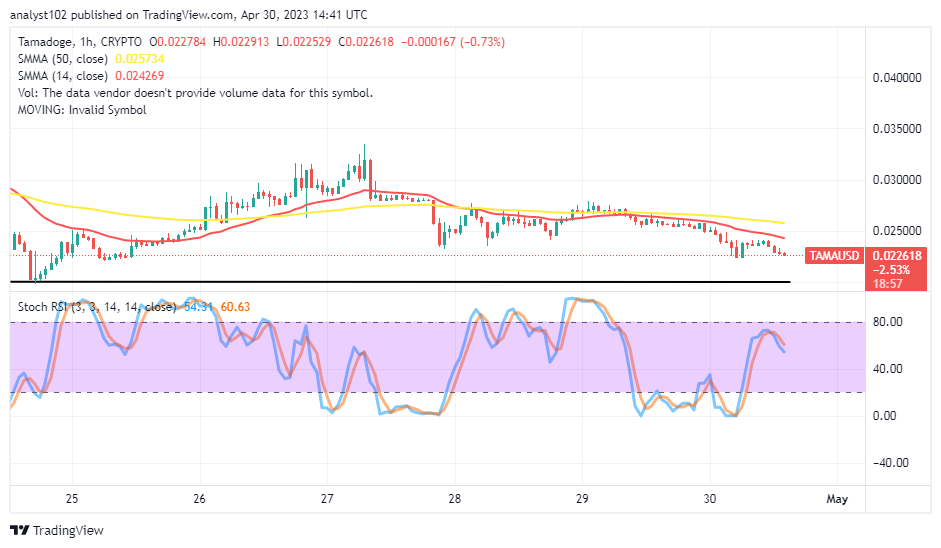
The TAMA/USD 1-hour chart shows the crypto business is systemically downsizing to rebuild a bullish path from a lower-trading support zone. The 14-day SMA indicator has managed to curve southward slightly past the $0.02500 psychological point to trend at $0.024269 below the 50-day SMA indicator at a close range of $0.025734. The Stochastic Oscillators have crossed southbound beneath the 80 to 60.63 and 54.31 levels. Traders needed to wait for a direction change in the Oscillators, favoring an upside signal.
Forget about Babydoge, TAMA is winning! In the coming days, it will be listed on top CEXs.
Do you want a coin that would 100X in the next few months? That is Tamadoge. Buy TAMA today
Note: Forexschoolonline.com is not a financial advisor. Do your research before investing your funds in any financial asset or presented product or event. We are not responsible for your investing results.


Leave a Reply