Tamadoge Price Prediction, January 30
It appears that there have been concerted efforts to decline the valuation of Tamadoge for a while against the market worth of the US currency, as it has been that the crypto economy has suffered losses, deepening the base.
As long as that assumption is maintained, there will likely be more
production of even lower lows with no clear entry pattern to coincide with the most likely drops that can follow because aggressive velocities are not anticipated. Meanwhile, new investors should have no hesitation in perpetuating the fiction of long-term acquisition and position expansion.
TAMA/USD Market
Key Levels
Resistance levels: $0.0060, $0.0070, $0.0080
Support levels: $0.0040, $0.0030, $0.0020
TAMA/USD Medium-term Chart
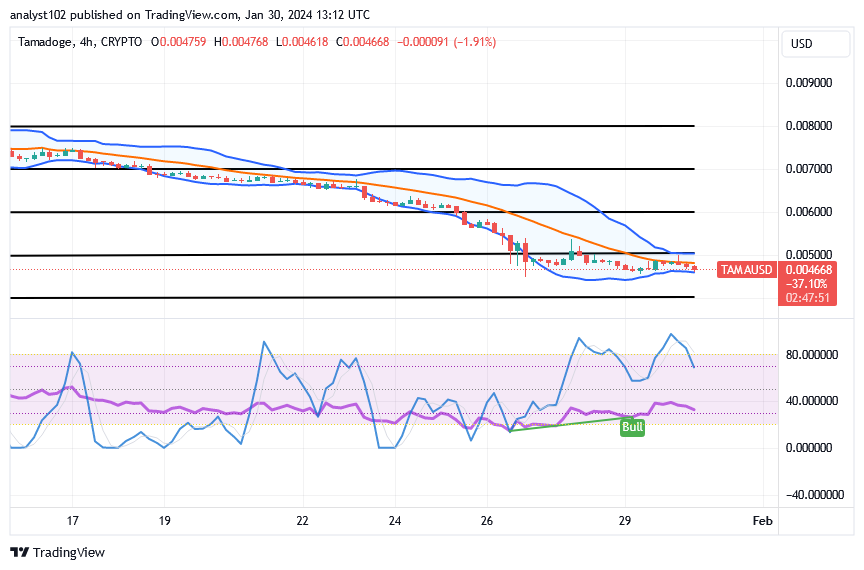
The TAMA/USD medium-term chart showcases the crypto-economic market’s strength, deepening its base probably to reset a hike input afterward.
The lower part of the Bollinger Band trend lines has been trying to get repositioned to make a baseline for a potential resumption of a rallying cycle. The stochastic oscillators have been placed with the blue line in the area of overbought to portend that a line of falling forces is gradually getting back in shape. Buying pressures are likely to see more delay with probable smaller reductions.
As the TAMA/USD trade is currently at $0.0046, why is it not rational for sellers to keep pushing alongside the lower Bollinger Band?
It would be a difficult time for bears to intend to push fearfully against the lower Bollinger Band as the TAMA/USD market loses momentum, deepening its base to possibly reset a hike input.
In a nascent crypto economy, it is not theoretically worthy of moving further south, especially when it is trading in lower ranges with the intention of reaching a strong new all-time low. Having said that, the situation has been holding steady for some time in order to obtain a position pattern and a rebound index. It would be difficult to see a resuming line of bullish movements as long as that anticipation is maintained.
TAMA/USD short-term chart
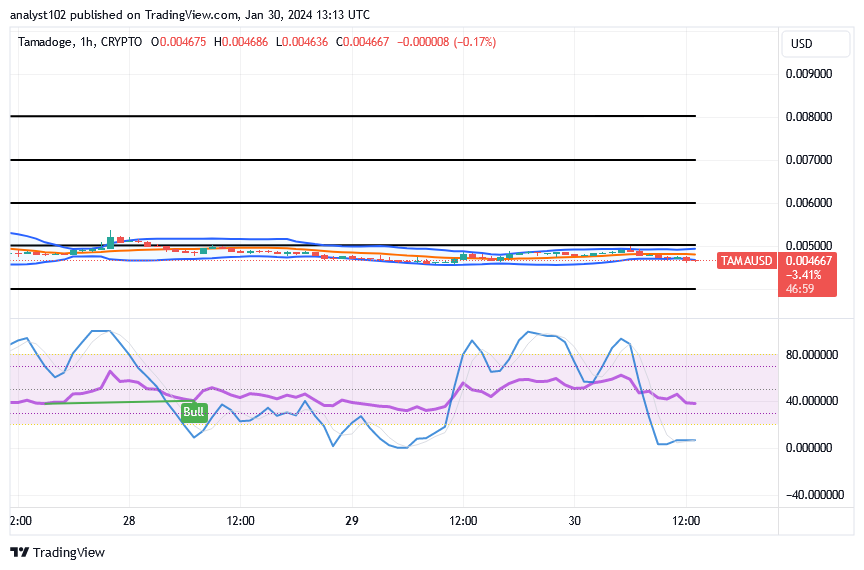
The TAMA/USD short-term chart showcases the crypto-economic trade losses energy, deepening the rises base to reset the bounces index.
It has been seen that the Bollinger Bands’ composure-forming trend lines have been gradually diminishing easterly about the $0.005 mark over time. The hourly outlook’s stochastic oscillators have indicated that an oversold situation exists. Watch for the appearance of a bullish candlestick to determine whether to place an immediate purchase order.
We are thrilled to inform you that Tamadoge will be relocating to Polygon! Read the information on our Discord channel or in this thread. 1/8
We’re excited to announce that Tamadoge is moving to Polygon! Read the details in this thread or on our discord. 1/8 pic.twitter.com/PjgxJa8TDa
— TAMADOGE (@Tamadogecoin) January 29, 2024
Do you want a coin that would 100X in the next few months? That is Tamadoge. Buy TAMA today
Note: Forexschoolonline.com is not a financial advisor. Do your research before investing your funds in any financial asset or presented product or event. We are not responsible for your investing results.


Leave a Reply