Tamadoge Price Prediction – May 5
Trading activities have been lessening to the extent of letting the Tamadoge market stands the chance of regaining pull-ups against the US Dollar around the support pivotal line of $0.02000. There has been a minute positive percentage rate at 0.19 in trading as the pushing force between buyers and sellers has relatively been around the points not far from the value line. Both new long-position entrants and seasoned investors will have the opportunity to potentially enhance their positions and portfolios due to an excessive recurrence of decimal numbers.
TAMA/USD Market
Key Levels
Resistance levels: $0.02500, $0.02750, $0.03000
Support levels: $0.01750, $0.01500, $0.01250
TAMA/USD – 4-hour Chart
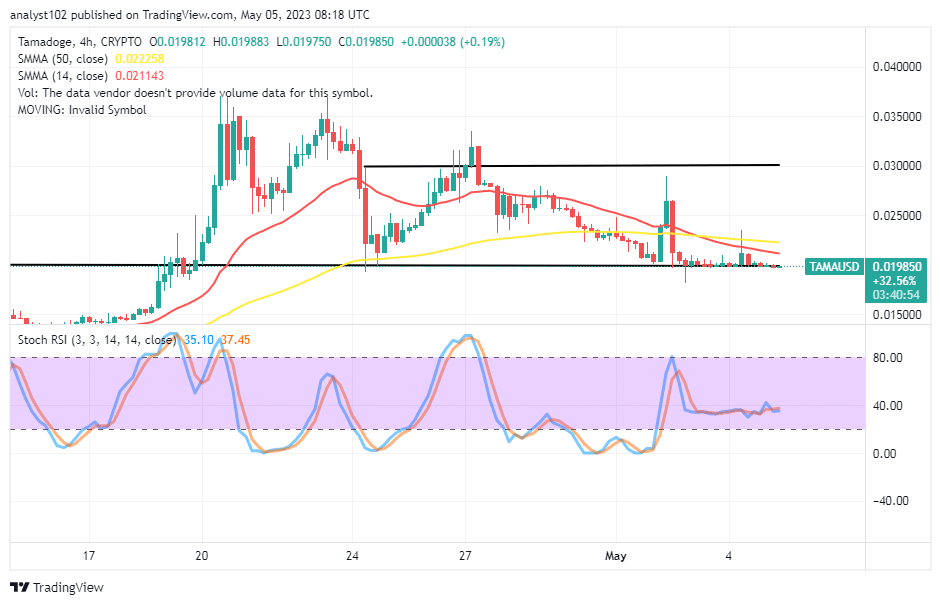
The TAMA/USD 4-hour chart shows the crypto-economic price declines to regain pull-ups, keeping underneath in a ranging format below the sell signal side of the SMA trend lines. The 50-day SMA indicator’s $0.022258 value line crosses the 14-day SMA indicator’s $0.021143 line to the south. The Stochastic Oscillators are now moving in a consolidation style around 40, keeping 37.45 and 35.10 levels to denote that they have a lesser potential rate of traveling further southbound than embarking upon a journey signaling a resumption of up-rises shortly.
What does the current interception of the SMAs portend concerning the TAMA/USD market operation?
The interception of the 50-day SMA trend line by the 14-day SMA trend line to the downside suggests that the price may not timely recover in the TAMA/USD trade operations as the crypto-economic price declines to regain pull-ups. Variant 4-hours candlesticks have featured predominantly over time around the $0.02000. Buying sprees shouldn’t suspend for no cause.
On the downside of the TAMA/USD technical analysis, there has been a persistence of ranging lows capable of creating a whipsawed session if the market has to go further down from $0.02000. Nonetheless, it won’t be a palatable decision for bears to intend to add more pressure to the south side even though the market tempts to hold long below the SMA trend lines
TAMA/USD 1-hour chart
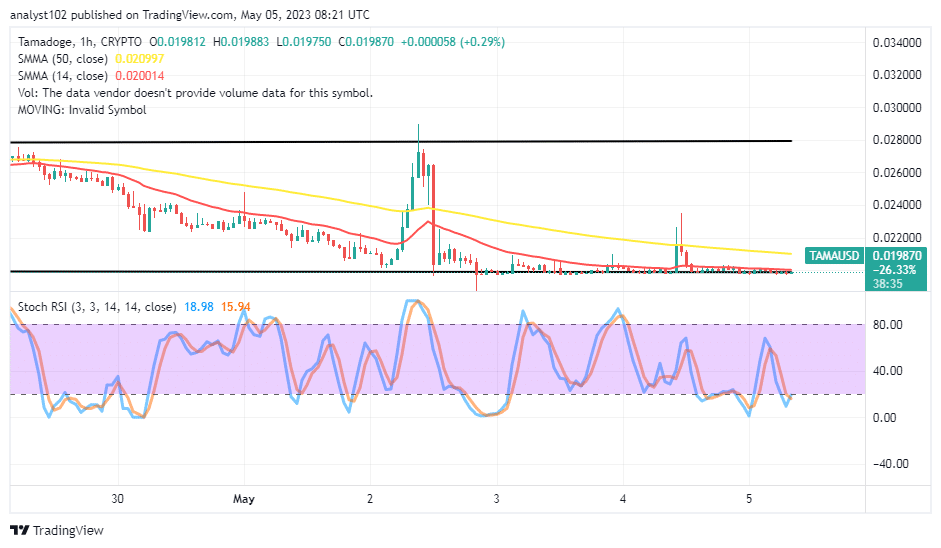
The TAMA/USD 1-hour chart showcases the crypto-economic price declines to regain pull-ups from around the horizontal line drawn at $0.02000. The 50-day SMA indicator is above the 14-day SMA indicator. Initially, some upsurges surfaced through the resistance of the SMAs within two hours during yesterday’s session. The Stochastic Oscillators have faintly penetrated the oversold region at 15.94 and 18.98 levels. The US currency will soon lose the momentum, as usual, to let the base trading cryptocurrency bounce back in its valuation.
Forget about Babydoge, TAMA is winning! In the coming days, it will be listed on top CEXs.
https://twitter.com/Tamadogecoin/status/1653374559079342080/photo/1
Do you want a coin that would 100X in the next few months? That is Tamadoge. Buy TAMA today
Note: Forexschoolonline.com is not a financial advisor. Do your research before investing your funds in any financial asset or presented product or event. We are not responsible for your investing results.


Leave a Reply