Tamadoge Price Prediction – July 13
In a bid to prolong the manner in which the US coin has been responding against the valuation of the Tamadoge, the crypto-economic price has been observed to crush briefly, holding a bounce sign despite the fact that it still hovers in the lower-trading zone.
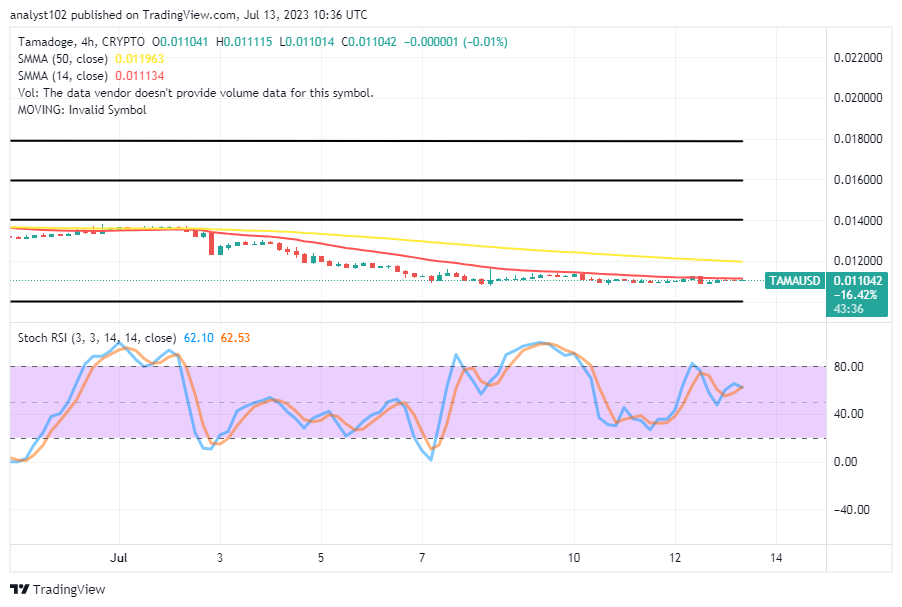
The degree of responsiveness of the major market movers has kept at a low pace within specific range-bound spots of $0.01200 and $0.01000. As of the writing of this article, transactions have been made in the last few hours of today’s operations between $0.011115 and $0.011014 at a minimum minute figure of 0.01 positive. Our conclusion is still that purchasing attempts should continue, but overleveraging shouldn’t be permitted to occur at any particular time.
TAMA/USD Market
Key Levels
Resistance levels: $0.01300, $0.01400, $0.01500
Support levels: $0.01000, $0.00900, $0.00800
TAMA/USD – 4-hour Chart
The TAMA/USD 4-hour chart reveals that the price of the crypto business crashes briefly, holding a bounce sign even in the progression of that.
The prevalence of selling activities as demonstrated by the bears in the TAMA/USD market stands a risk of getting whipsawed in no time, as there may soon be an aggressive push against the indicators to the moon side. The 14-day SMA indicator has been found to be placing resistance on the price underneath the 50-day SMA indicator, with a notable space between them. The Stochastic Oscillators’ position between 62.53 and 62.10 indicates that a low is about to form.
What market direction does the current state of the TAMA/USD price exchanges indicate?
There has been no more distinct direction that the TAMA/USD market upholds that is so different from the one that it has been briefly keeping to the south, given that it has been holding a bounce sign that can as well cause a navigation toward breaking through resistances in the long run when the time matures.
Long-position takers and investors might lessen their viability trade vibes if they have been loaded with multiple positions, except the new intending buyers could begin to come in through any further decreasing movement that could surface along the line from this moment. 
TAMA/USD 1-hour chart
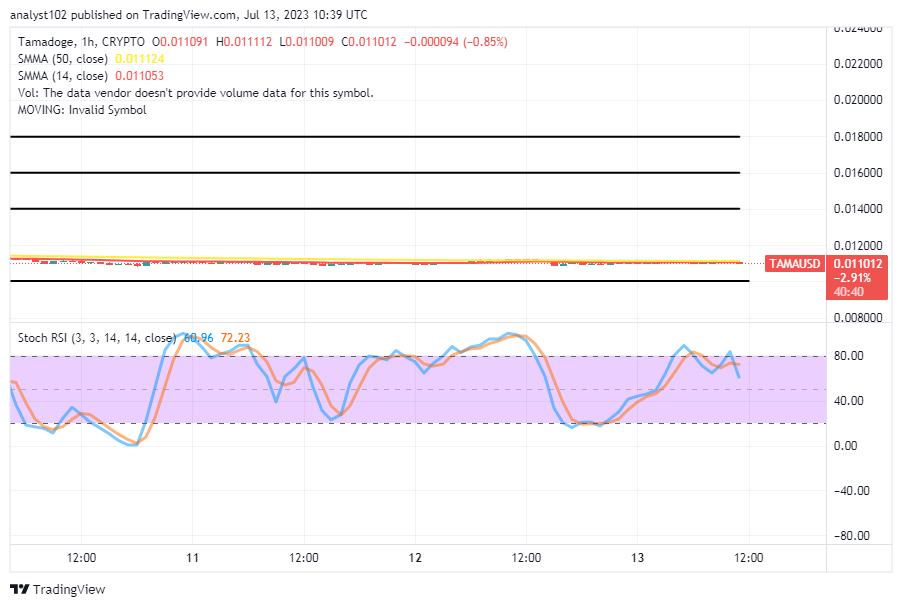
The TAMA/USD 1-hour chart showcases that the crypto market price has been crushing briefly, holding a bounce sign.
Different smaller candlesticks have formed patterns around the indicators’ trending phase to the east, signaling a dip in the trade. The 14-day SMA trend line and the 50-day SMA trend line have remained in a conjoining mood to affirm that the moves are in ranges to some extent. The Stochastic oscillators have slightly crossed southbound from the overbought region to 72.23 and 60.96 levels. That causes a steer to be cautious about longing for a while. However, the precautionary index could fade off in a short time.
Prize pools are about to close; therefore, leaders must finish first.
Prize pools… closing… must reach… top spot on leaderboards… pic.twitter.com/aI6FYOLOst
— TAMADOGE (@Tamadogecoin) July 12, 2023
Do you want a coin that would 100X in the next few months? That is Tamadoge. Buy TAMA today
Note: Forexschoolonline.com is not a financial advisor. Do your research before investing your funds in any financial asset or presented product or event. We are not responsible for your investing results.


Leave a Reply