Tamadoge Price Prediction – September 28
As there have been positions standing in to represent an exhaustion of falling forces in the opting processes that involves the valuation of Tamadoge versus the US currency, given that the crypto-economic price bounces from the pivotal point of $0.008000, pushing via resistances up to the point of $0.009500.
The mode of reversal that has been exhibited in the market following the hitting of a resistance around the value line of the $0.009500 could lead to producing a chain of shifts back to the south side for other round of reduction buying order process to regain. Nevertheless, buying spree habits should continue to stage alongside investment ideology. Therefore, those longing positions at higher trading lines in the past should not close because the projection possibility volume of trade for this emerging crypto business is still far undervalued.
TAMA/USD Market
Key Levels
Resistance levels: $0.01000, $0.01100, $0.01200
Support levels: $0.00800, $0.007500, $0.007000
TAMA/USD Medium-term Chart
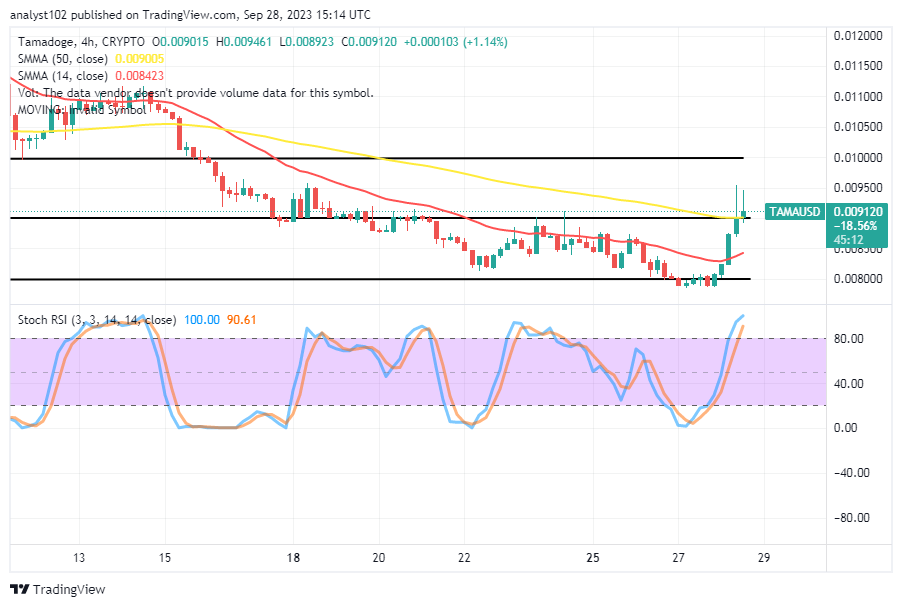
The TAMA/USD medium-term chart reveals that the crypto-economic price bounces upward from the critical support spot of $0.008000, pushing via resistances to the tune of $0.009500.
A 4-hour candlestick has formed to showcase that a reversal moving pattern could come up around the value line mentioned as there has been a reading situation denoting that the Stochastic Oscillators have penetrated the overbought region to place between 90.61 and 100. The 14-day SMA indicator is at $0.008423 underneath the $0.009005 value line of the 50-day SMA indicator.
Has there been a peaked trade condition in the TAMA/USD market warranting a stop to seeing more ups?
Even though there has been a reversal motion coming as an early sign against seeing more rises in the valuation of TAMA/USD market, given that the crypto trade bounces, pushing via resistances from the point of $0.008000.
The trending pressure moves to the upside are still in a topnotch considering the posture pace that is been put out by the position of the Stochastic Oscillators from the angle of a daily chart. With the running of that sentiment positively exercising, buyers should continue to push alongside the moves until a higher resistance spot proves tougher to be breached in the end. But, investors approach should be to allow their presences to grow on the threshold of long-term basis.
TAMA/USD Short-term chart
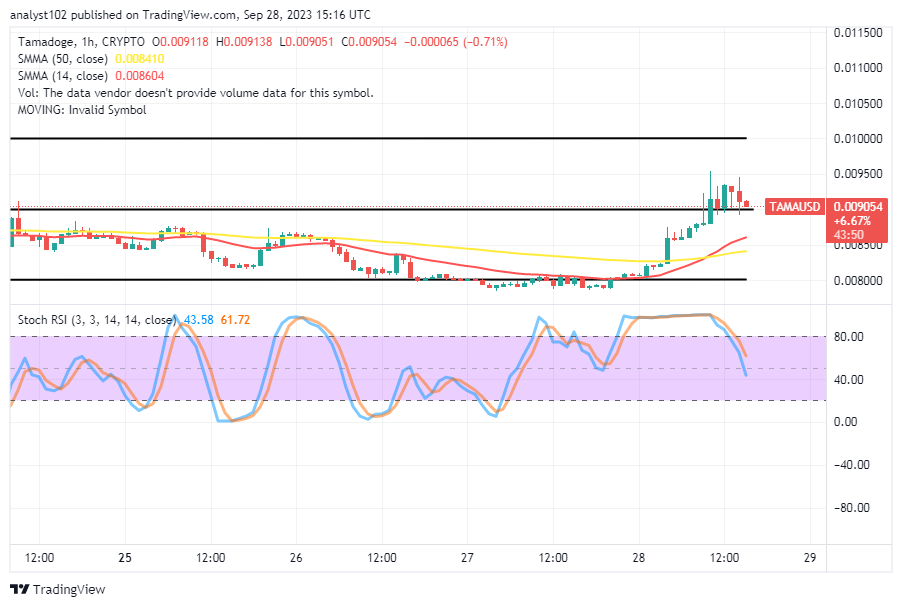
The TAMA/USD short-term chart mirrors the crypto market bounces from the point of $0.008000 to converge at a higher resistance point closely beneath the value line of $0.009500, pushing via resistances.
The 14-day SMA trend line has intercepted the 50-day SMA trend line to the north side. The Stoxhastic Oscillators are in a southbound-crossing posture from the overbought region to position from 61.72 to 43.58, sounding a notice of cautiousness in the method of exercising a buy order. Stakeholders should not put off the habit to add more to their sizes of their investment plans.
During the month of October, the following 10 million TAMA will be burned.
🔥 4 Million $TAMA Burned 👉https://t.co/JBnnOUtAbv
— TAMADOGE (@Tamadogecoin) September 28, 2023
Next Burn 10 Million $TAMA in October 🎃
Check all the details about future burns here: https://t.co/CweV78geeJ pic.twitter.com/pAnWIz66tj


Leave a Reply