Tamadoge Price Prediction – October 21
There has been maintenance of slow-and-steady moving motions relatively enjoyed by bears to some reasonably extent in the exchange lines of Tamadoge versus the valuation of the US Dollar, as the crypto-economic price bounces around the point of $0.00800, keeping above the value of $0.0075.
In the current circumstances, it is still possible to redefine the stances in order to obtain respectable longing position instructions. As the price is currently trading around the level of $0.007903, the major indicator reveals that $0.007633 remains the critical lower point before the $0.0075 support level. The long-term continuation of shopping binge behaviors is still our trade suggestion verdict.
TAMA/USD Market
Key Levels
Resistance levels: $0.008500, $0.009000, $0.009500
Support levels: $0.007500, $0.007000, $0.006500
TAMA/USD Medium-term Chart
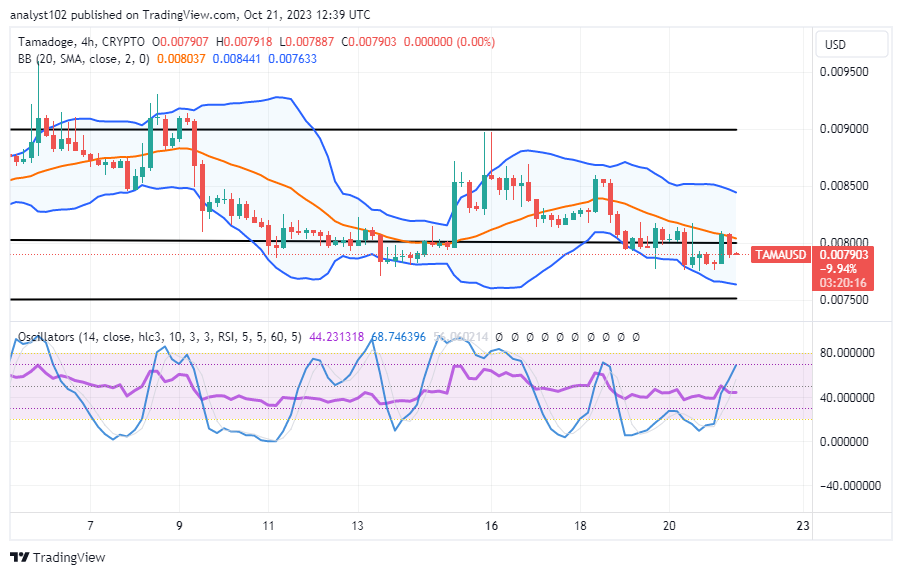
The TAMA/USD medium-term chart reveals that the crypto-economic price bounces, staying above the support level of $0.0075.
The Bollinger Band trend lines are positioned at $0.008441 and $0.008037, and the lower part is situated at $0.007633. The stochastic oscillators have traveled northbound from an oversold region to a place from 44.231318 to 68.746396. From the technical side of things, the formation of trading candlesticks has not projected a quick change in trade zones different from those of $0.008500 and $0.007500 that the market has been embodying over time in the near future.
What is the main barrier-trading line for the current TAMA/USD market operations pricing spot?
Based on what is obtainable in the market presently, the TAMA/USD market bulls have to contend with a trade-barrier level as showcased by the middle Bollinger Band trend line at $0.008037, given that the crypto-economic price bounces, keeping above the point of $0.007500.
The stochastic oscillators’ current reading of velocity weight suggests that buyers may go through a session of momentum building before moving aggressively to the upside above the fundamental support levels mentioned at the top. Sellers should use caution when pushing through any apparent declining forces that are forming a ring around the middle of the Bollinger Band.
TAMA/USD Short-term chart
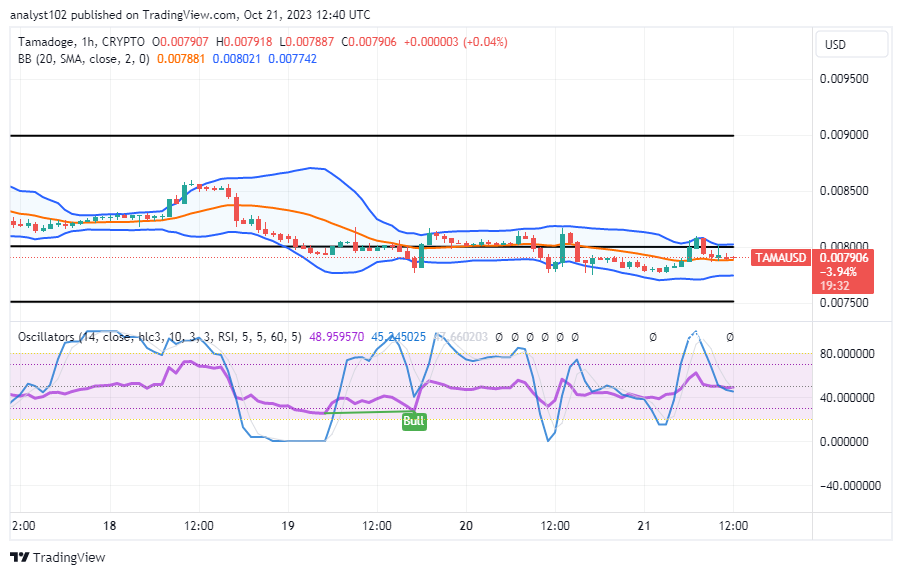
The TAMA/USD short-term chart reveals the crypto-economic price bounces, keeping above the underlying support level of $0.007500.
The stochastic oscillators are in the range of 48.959570 to 45.245025, indicating a potential dropping trend. The middle line of the Bollinger Band trend line is at $0.007881, the lower line is at $0.007742, and the upper line is at $0.008021. The trade-speculating fact figures of the developing crypto company economy continue to be constrained, making it difficult for new prospective investors to join before the primary cycle for significant increases.
Now available for sale are ultra-rare NFTs! Price to Start: 1 WETH Type of Listing: Fixed-Time Auction
Attention #TamadogeArmy!📣#Tamadoge Ultra Rare NFTs Are Up For Sale Now!🤩
— TAMADOGE (@Tamadogecoin) October 6, 2022
Start Price: 1 WETH
Listing Type: Fixed Time Auction
Auction Length: 7 days
Buy Now On @opensea And Get A 90% Better Chance Of Being In The Top 3 On Our Global Leaderboards💪⬇️https://t.co/hUtUDoLqzh pic.twitter.com/AiSfNTD9HX
Do you want a coin that would 100X in the next few months? That is Tamadoge. Buy TAMA today
Note:Forexschoolonline.com is not a financial advisor. Do your research before investing your funds in any financial asset or presented product or event. We are not responsible for your investing results.


Leave a Reply