Tamadoge Price Prediction, December 3
There has been a kind of sequential trade activity between bull and bear that showcases that the market movements have been managing to swing from around the point of $0.00800, as it is currently given that the TAMA/USD trade averages the resistance of $0.009, tending reverses.
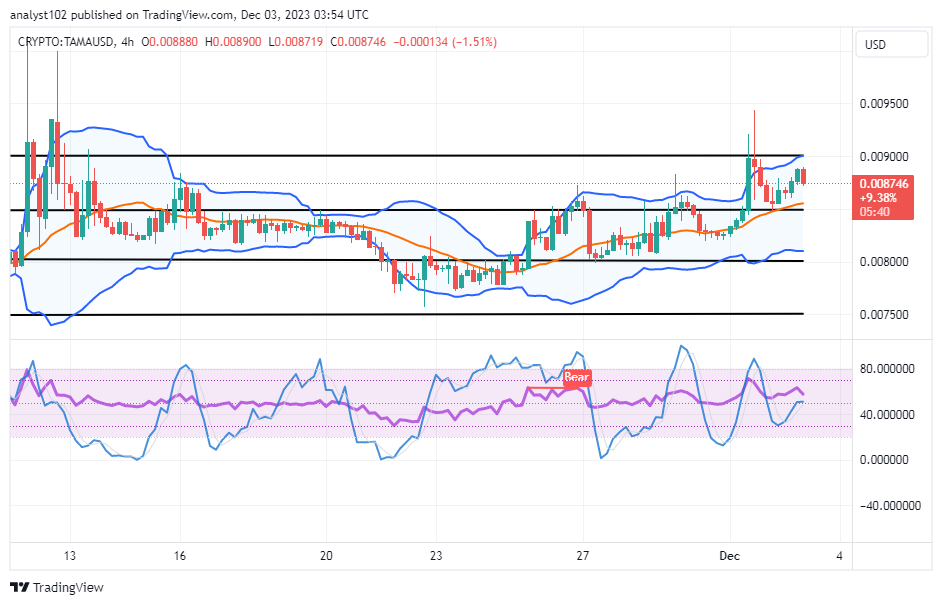
Price is seen to be trading at a negative percentage rate of 1.51, centered around the value of $0.008746 at this material value of time. It demonstrates that buyers are progressively operating in a relaxed mode, which may lead to the elongation of range-bound zone limits. Investors and long-position takers should maintain their positions ahead of the significant anticipated bounces, disregarding the directional outcomes that follow.
TAMA/USD Market
Key Levels
Resistance levels: $0.009500, $0.01000, $0.01050
Support levels:$0.00800, $0.007500, $0.007000
TAMA/USD Medium-term Chart
The TAMA/USD medium-term chart showcases the crypto trade averages the point of $0.009, tending reverses.
The stochastic oscillators are slightly bent in a southbound-moving mode above the point of 40. A sizeable bearish candlestick is in the making between the spaces of the upper and middle Bollinger bands. The value lines between $0.00900 and $0.00800 have been marked as the Bollinger Bands’ highest and lowest psychological zones of the bargaining process.
At the $0.009 threshold, should sellers in the TAMA/USD market now take more aggressive positions?
Short-position pushers would have to be systemically strategized whenever they intend to execute a shorting order around the upper range line, as the TAMA/USD trade averages line of $0.009, tending reverses.
Because buyers have been unable to pull with steady inputs, bears have been able to consistently lower the crypto economy at the $0.009 mark. But as a result of that particular scenario, chances have emerged for both new and returning investors ahead of more active trading periods, which should materialize in the coming months.
TAMA/USD short-term chart
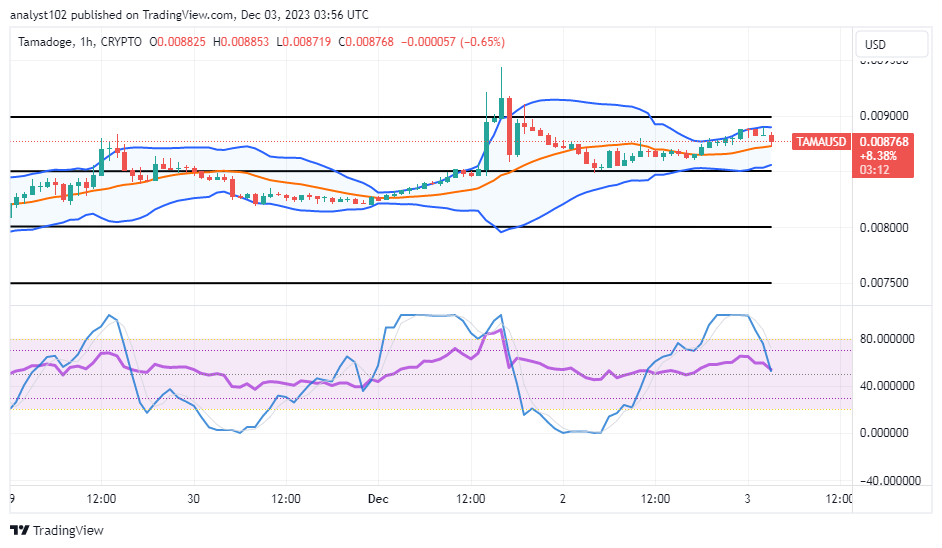
The TAMA/USD short-term chart shows the crypto business averages the point of $0.009, tending reverses.
All of the Bollinger Band indicators have moved somewhat northward, landing somewhere between $0.00900 and $0.0085. The stochastic oscillators are hovering just over the 40-point and are turning slightly southerly. We believe that in order to profit as much as possible at the conclusion of a bullish marketing trend, buyers should stick to the trading ideology of position accumulation processes at reduction zones over the long term.
Begin your amazing journey with Tamadogi and begin earning $TAMA rewards right now.
Welcome to the Tamaverse 🐶
— TAMADOGE (@Tamadogecoin) December 1, 2023
Get started on your pawesome journey with Tamadogi and start earning $TAMA rewards today 👇
📱 Android: https://t.co/RfZIZOLIDh
📱 iOS: https://t.co/du3iRej7HC pic.twitter.com/NrKLNC3u5j
Do you want a coin that would 100X in the next few months? That is Tamadoge. Buy TAMA today
Note:Forexschoolonline.com is not a financial advisor. Do your research before investing your funds in any financial asset or presented product or event. We are not responsible for your investing results.


Leave a Reply