Tamadoge Price Prediction – August 16
Over several days of business transaction lines in the market operations involving Tamadoge against the US Dollar’s worth, so many downturns have been witnessed as the crypto economy touches a base and tries to make hikes at many other times to raise the optimistic trade myth of bulls that the emerging coin will thrive in the long-term run afterward.
Investors should have faith that the projected market valuation for TAMA will soon outpace the use of American currency. Buyers are instructed to steadfastly maintain whatever running purchase points they may have made in light of potential negative developments based on that assumption. On a higher-promissory mole, a rebounding scenario is accumulating day by day.
TAMA/USD Market
Key Levels
Resistance levels: $0.008500, $0.009000, $0.009500
Support levels: $0.007000, $0.006500, $0.006000
TAMA/USD Medium-term Chart
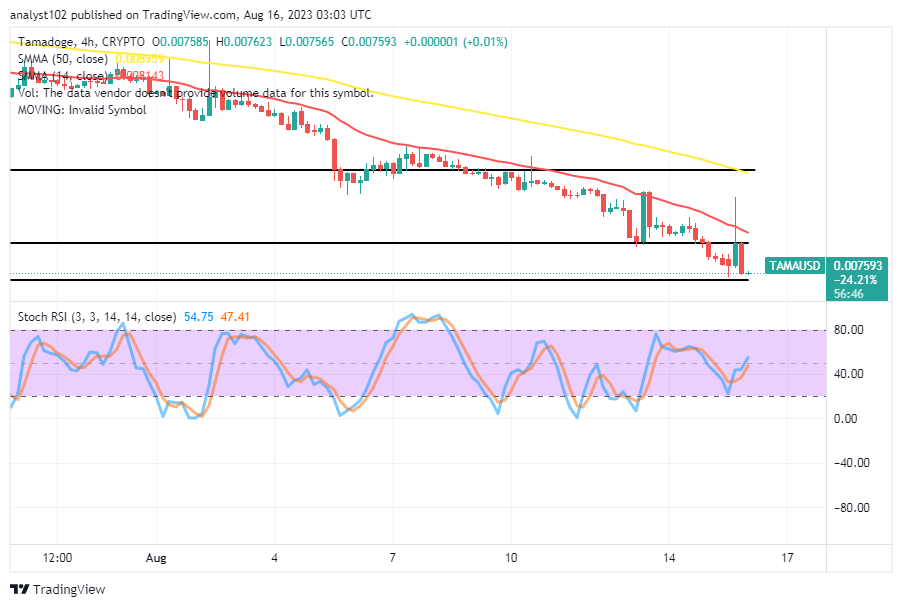
The TAMA/USD medium-term chart reveals that the crypto market touches a base and is making hikes to keep the presumed massive rising moments in the pipeline.
In the few hours to the end of yesterday’s session, a bullish candlestick formed through some points to hit resistance around $0.0086000 before returning to a retracement movement. The 14-day SMA trend line is at $0.008143 beneath the $0.008959 value line of the 50-day SMA trend line. The Stochastic Oscillators are placed between 47.41 and 54.75 to denote that a tentative rising force is on the card as of this technical piece.
Is it still safe for sellers to keep shorting their holdings as long as the TAMA/USD market continues to hold down bearishly?
There might also be a degree of a safer trade environment for the TAMA/USD market bears to short their positions, especially when a volatile rise is made and billed for an early reversal motion as the crypto coin touches a base and makes hikes recently.
To determine whether additional lower sinking values will be produced to give holders of long positions leverage on price decreases would be the reversal movement, nonetheless. Sellers should exercise caution before simply entering the market, particularly if the price has fallen below the Moving Averages’ trend lines. The optimal zone to launch backlonging position orders will be points below the SMAs.
TAMA/USD Short-term chart
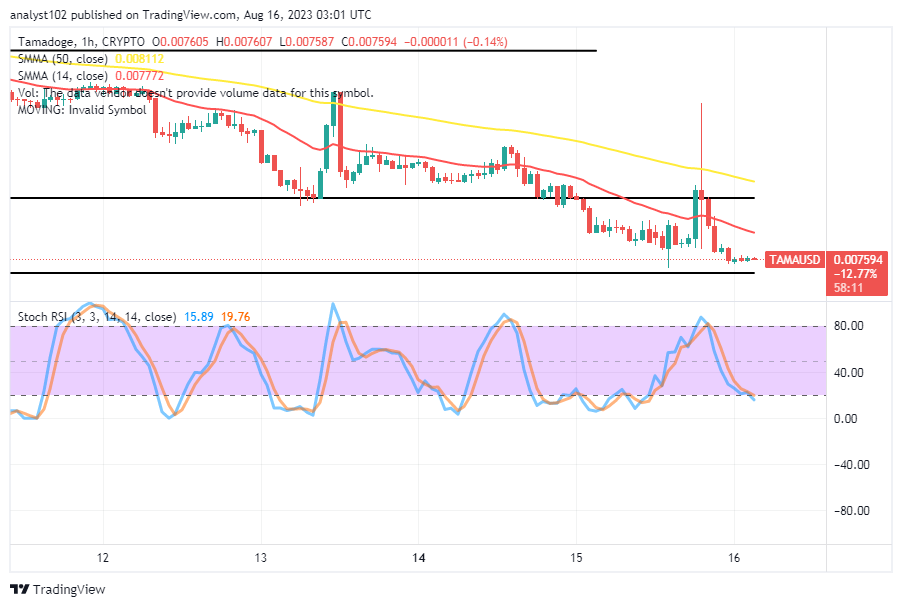
The TAMA/USD short-term chart reveals that the crypto-economic price touches a base and has begun to make hikes, breaking through the penultimate decline lines.
With a pattern of candlesticks depicting a line of upsurges, followed by downswings back to the last lower trading area, bordering around $0.007500, the 14-day SMA indicator is located beneath the 50-day SMA indicator. From 19.76 to 15.89, the Stochastic Oscillators are positioned roughly southward, indicating that a line of reduction may still be in effect. On the contrary, we advise against stopping buying operations.
You can participate in the action on the following App and Play stores:
The Tamadoge Arena app is now available on both iOS & Android 🎉🥳
— TAMADOGE (@Tamadogecoin) August 15, 2023
You can get in on the action in the App and Play stores below:
🍏: https://t.co/WyyDKANVwL
🤖: https://t.co/INCaGendE4
Download the app now! pic.twitter.com/mzg9F8BQS3
Do you want a coin that would 100X in the next few months? That is Tamadoge. Buy TAMA today
Note: Forexschoolonline.com is not a financial advisor. Do your research before investing your funds in any financial asset or presented product or event. We are not responsible for your investing results.


Leave a Reply