Tamadoge Price Prediction – June 16
The market operation of the Tamadoge swings concurrently against the valuation of the US Dollar, intending to bounce in its way of recovery bid. It has demonstrated as there is continuity in the re-appraisal analysis of the technicalities in this crypto that buying activities may have faced delays of pushing massively through variant resistances of achieving lost values. In line with that presumption, long-position takers shouldn’t be disturbed by any probable efforts to go underway unnecessarily further.
TAMA/USD Market
Key Levels
Resistance levels: $0.01500, $0.01600, $0.01700
Support levels: $0.01200, $0.01100, $0.01000
TAMA/USD – 4-hour Chart
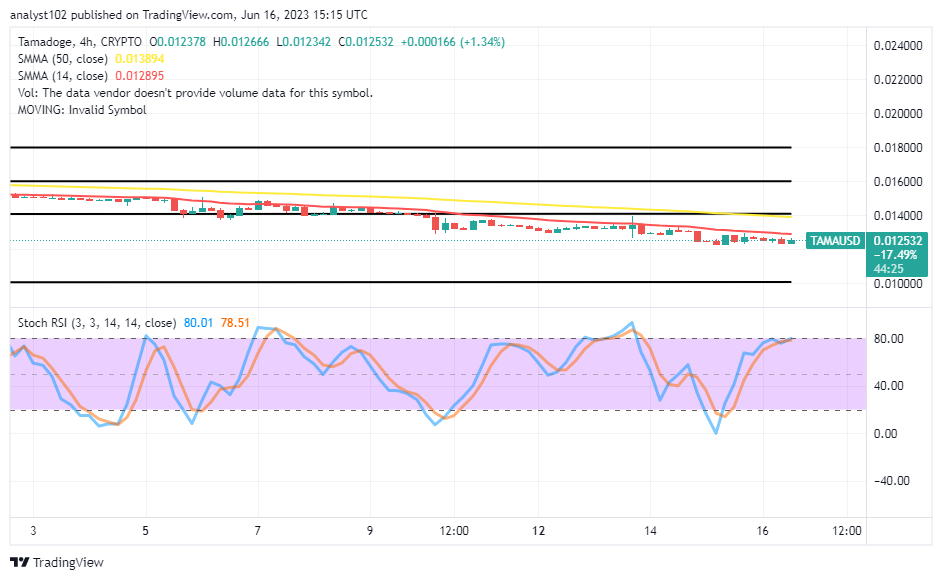
It has shown on the TAMA/USD 4-hour chart that the crypto-economic market swings concurrently, intending to bounce in the mood of exhausting much energy closely below the trend line of the smaller SMA. As of this technical piece, the 14-day SMA trend line is at $0.012895 beneath the $0.013894 point of the 50-day SMA trend line. The Stochastic Oscillators are around the 80 levels, positioning around 78.51 to 80.01 points to attentively indicate a probable decline sign is around the corner.
Should the TAMA/USD market buyers entertain fears toward launching an instant execution order when the price dips?
Dipping trade sessions of the TAMA/USD market will provide long-position takers who could grab the advantage of purchasing at a more reasonable and considerate rate even as the crypto-economic market swings concurrently, intending to bounce in no time. As we can see in the suspension issue, it may occasionally be necessary to move in the direction of an ideal trade formation pattern that results from the Stochastic Oscillators’ potency reading to claim a northward posture afterward. It merely requires the ability to remain patient.
TAMA/USD 1-hour chart
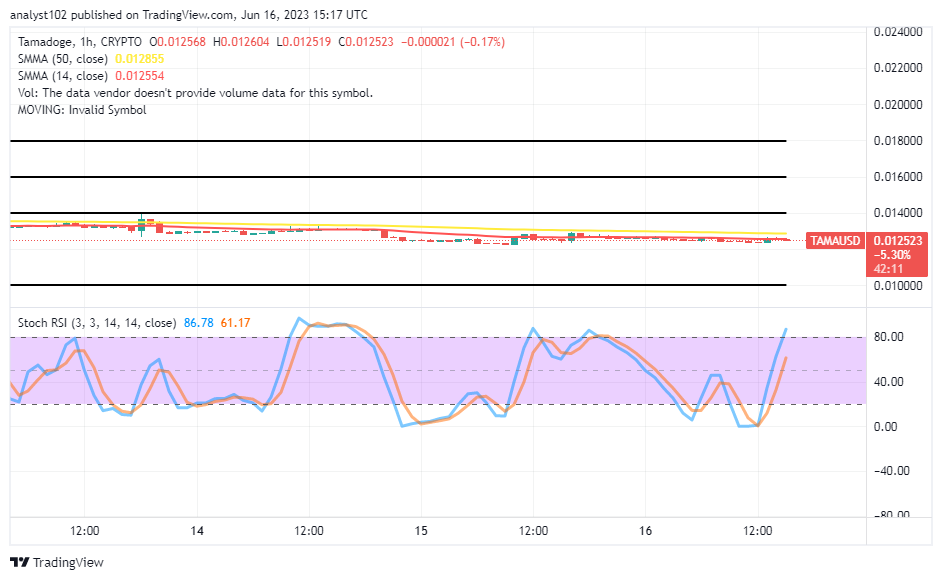
The 1-hour chart depicts that the crypto-economic market swings concurrently, intending to bounce from above the support-trading zone of $0.01200. The trade contrition outlook indicated by the 14-day and 50-day SMA trend lines shows that traders have bargaining around $0.012554 and below $0.012855. Therefore, those are the vital material values bugging retardation to the current trade. The Stochastic Oscillators have swerved northbound from the oversold region to place between 61.17 to 86.78 points. The US dollar appears to be preparing to oppose any moves that the base-trading crypto asset may try shortly, especially if those SMAs’ points remain unbreached to the north aggressively.
You may either get your hands on some $TAMA or hide your bones in the yard.
Buy the most useful memecoin here.
You could hide your bones in the yard, or you could get your paws on some $TAMA 💰
— TAMADOGE (@Tamadogecoin) June 16, 2023
Buy the best memecoin with utility here 👉 https://t.co/KONwEq5Glw pic.twitter.com/KKuDaQpEfu
Do you want a coin that would 100X in the next few months? That is Tamadoge. Buy TAMA today
Note: Forexschoolonline.com is not a financial advisor. Do your research before investing your funds in any financial asset or presented product or event. We are not responsible for your investing results.


Leave a Reply