Tamadoge Price Prediction – April 20
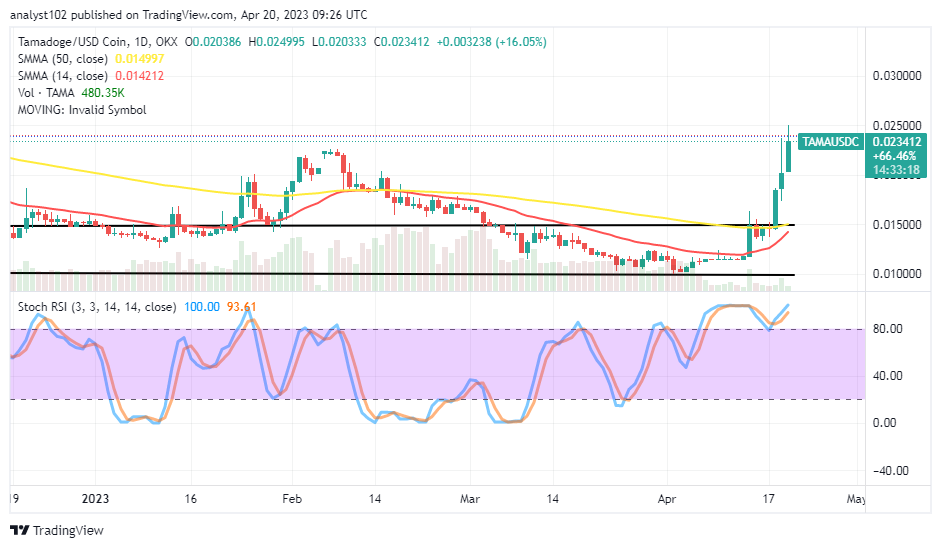
There has been a continual predominance of bears in the TAMA/USD trade activities in the last several trading days as the crypto-economic market surges through significant resistances to now capped between the high of $0.024995 and the low of $0.020333 trading value points. The price is currently 16.05 percentage point positives, which indicates that purchasers have been moving at a healthy pace thus far.
TAMA/USD Market
Key Levels
Resistance levels: $0.02500, $0.02750, $0.03000
Support levels: $0.01750, $0.01500, $0.01250
TAMA/USD – Daily Chart
The TAMA/USD daily chart showcases the crypto market surges through significant resistances in a straight-line format above the trend lines of the SMAs. The 14-day SMA indicator is at $0.014212, close below the $0.014997 value line of the 50-day SMA indicator. The Stochastic Oscillators have stretched northbound into the overbought region at 93.61 and 100.00 points, indicating the possibility of not seeing the moves succumbing to a quick reversal mode.
Should the TAMA/USD market traders look beyond the resistance of $0.02500 going by the current uprising force pace?
It is not psychologically okay to continue to push for more rises above the resistance trading of the $0.02500 because the TAMA/USD market has surged through significant resistances to test it in the process recently. The price has achieved a peak session that calls for a necessary retracement to appear soon. A long-position holder has to refrain from launching new yearning orders for a while.
On the downside of the technical analysis, time is getting ripening toward seeing a formation that will suggest the moment of price rejections around the resistances of $0.02500. A sudden breakout at that point will possibly be to complete a buying cycle which may not be stable through the resistance between that point and the $0.03000. A formidable bearish-trading candlestick is required to signify the real-time period to begin to take off some longing orders in profits before a massive correction comes up unprecedentedly.
TAMA/USD 4-hour chart
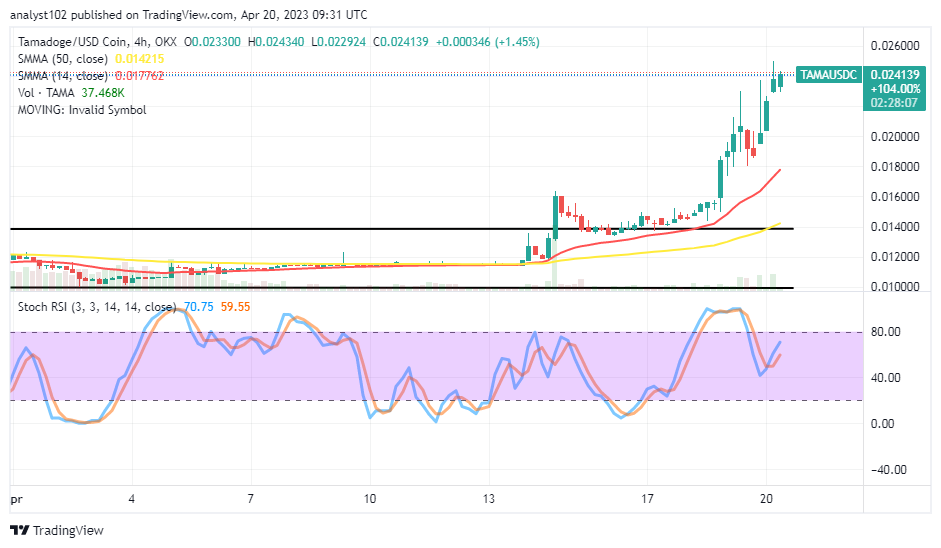
On the 4-hour chart, it is also that the crypto-economic market surges through significant resistances in a straight-line moving mode over the buying signal side of the SMA trend lines. The 14-day SMA indicator points to the north around $0.01800 below the current trading spot, as the 50-day SMA indicator is underneath it. The Stochastic Oscillators have initially moved southbound between the 60 and 40 levels. But, they have now crossed back northward to 59.55 and 70.75. That signals some appreciation could still materialize afterward. But, bulls would have to be wary of jumping into the trade to avoid an unnecessary whipsawed trading moment that could as well play alongside.
Do you want a coin that would 100X in the next few months? That is Tamadoge. Buy TAMA today
Note: Forexschoolonline.com is not a financial advisor. Do your research before investing your funds in any financial asset or presented product or event. We are not responsible for your investing results.
Learn to Trade Forex Online
Tamadoge (TAMA/USD) Market Surges Through Significant Resistances
Footer

ForexSchoolOnline.com helps individual traders learn how to trade the Forex market
WARNING: The content on this site should not be considered investment advice and we are not authorised to provide investment advice. Nothing on this website is an endorsement or recommendation of a particular trading strategy or investment decision. The information on this website is general in nature so you must consider the information in light of your objectives, financial situation and needs.
Investing is speculative. When investing your capital is at risk. This site is not intended for use in jurisdictions in which the trading or investments described are prohibited and should only be used by such persons and in such ways as are legally permitted. Your investment may not qualify for investor protection in your country or state of residence, so please conduct your own due diligence or obtain advice where necessary. This website is free for you to use but we may receive a commission from the companies we feature on this site.
We Introduce people to the world of currency trading. and provide educational content to help them learn how to become profitable traders. we're also a community of traders that support each other on our daily trading journey
Forexschoolonline.com is not a financial advisor. Do your research before investing your funds in any financial asset or presented product or event. We are not responsible for your investing results.

Leave a Reply