Tamadoge Price Prediction – August 1
Bears’ trading forces in the TAMA/USD trade operations have continually been held ineffective at $0.1000 to showcase that the crypto market steps around the value as it aims to hike its valuation at any time.
As bulls have yet to make a serious move toward accomplishing favorable higher pushes over various resistances, it looks like there are still many activities that need to occur around the $0.01000 line. As of this early stage of authoring a technical article, trade zones for today range between $0.010100 and $0.01044.
TAMA/USD Market
Key Levels
Resistance levels: $0.01100, $0.01150, $0.01200
Support levels: $0.00950, $0.00900, $0.00850
TAMA/USD Medium-term Chart
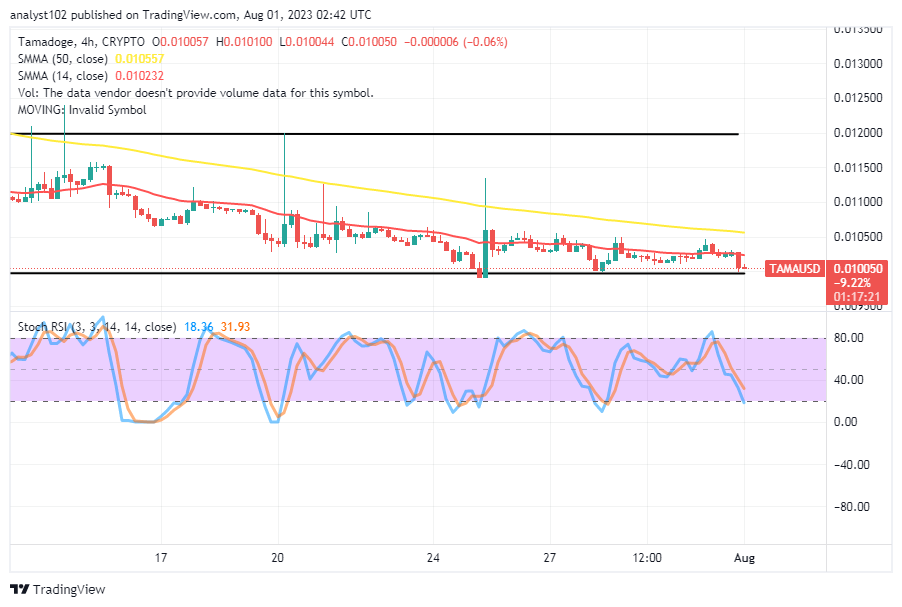
The TAMA/USD medium-term chart reveals that the crypto-economic market steps around $0.01000 and aims to hike from the point as it has experienced overly in recent times.
The 14-day SMA trend line has been placed at $0.010232 underneath the $0.010557 value line of the 50-day SMA trend line. The Stochastic Oscillators have crossed in the direction of the south, giving a line of declining values from 31.93 to 18.31. That indicates the force on the downside is vast and approaching an end. Therefore, selling gravity is likely to have less effect in the near future.
What are the current TAMA/USD trade operations’ most controversial trade points?
Buyers and sellers have over the past couple of days been managing to make some smaller ups and lesser downs between $0.010500 and around $0.01000 as the TAMA/USD market steps around the smaller point and the price aims to hike possibly very soon.
Technically speaking, our belief still holds that there are a lot of possibilities associated with purchasing and holding strategies for any nascent crypto economy’s drops before they spiral. Only traders using the MT4 platform should make sure to always employ a stop-loss position order when going for shorting orders. Additionally, investors shouldn’t overstretch their equity positions in order to protect themselves from unwarranted margin calls. 
TAMA/USD Short-term chart
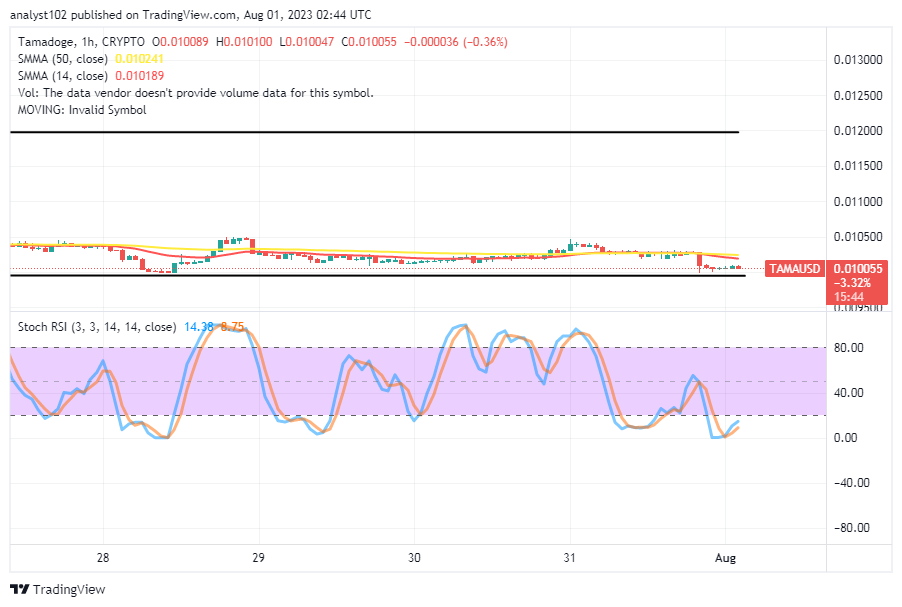
The TAMA/USD short-term chart showcases the crypto market’s steps around $0.01000 and aims to hike
As the 14-day SMA joins the 50-day SMA between $0.010189 and $0.010241, less active market activity has forced the trading indicators to stay inside predetermined range limitations. The Stochastic Oscillators are attempting to swing back from 8.75 to 14.38 points while being oversold. Takers of long positions may immediately launch a buy order at the time of analysis.
Interact with our moderators and community managers in real time, and share gaming advice with the rest of the Tama Army.
Updates happen at lightning speed here at Tamadoge ⚡
— TAMADOGE (@Tamadogecoin) July 31, 2023
Join our Telegram group to be first in line for news, giveaways and updates! 🤩
Chat directly with our mods and community leads, and trade gaming tips with the rest of the Tama Army 👾💪
📱:https://t.co/yPpSTpMp1p pic.twitter.com/3uz4oGaPLr
Do you want a coin that would 100X in the next few months? That is Tamadoge. Buy TAMA today
Note: Forexschoolonline.com is not a financial advisor. Do your research before investing your funds in any financial asset or presented product or event. We are not responsible for your investing results.


Leave a Reply