Tamadoge Price Prediction – November 8
A slight loss of momentum has been predominantly featured between buyer and seller in the operation of Tamadoge versus the purchasing weight of the US Dollar, given that the crypto-economic market stalls lowly against the value of $0.00800, inclining rises.
Although the trade is still in range-bound territory overall, the current scenario has been such that bulls are weakened, allowing the downward motions to average the crucial underlying support of $0.007500. It would be wiser to stake more cryptocurrency at a lower cost ahead of strong rebounding forces, the longer the current falling force tends to extend.
TAMA/USD Market
Key Levels
Resistance levels: $0.008500, $0.009000, $0.009500
Support levels: $0.007500, $0.007000, $0.006500
TAMA/USD Medium-term Chart
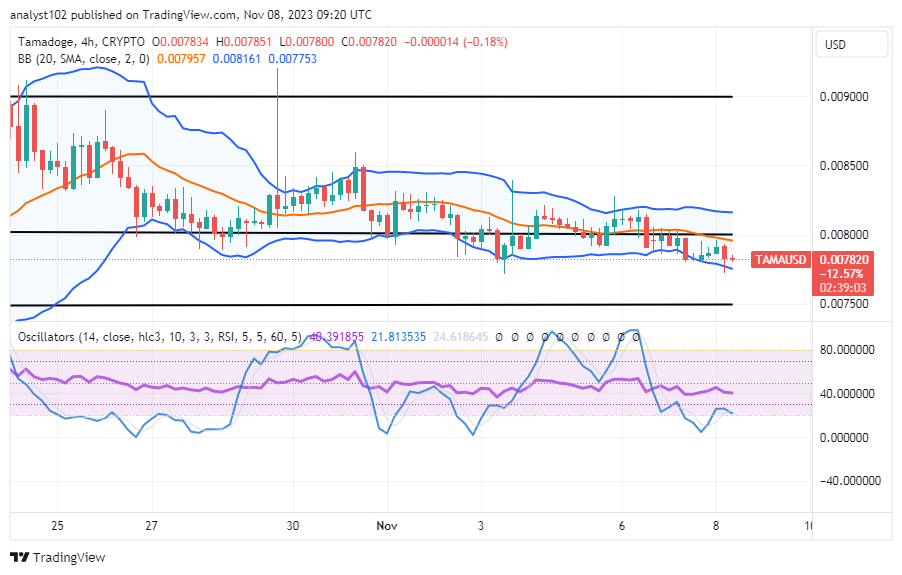
The TAMA/USD medium-term chart showcases the crypto economy stalling lowly and closely below the line of $0.00800, inclining rises.
It has been quite some days running into weeks that the positional points of the Bollinger Bands stay to signify that range-bound zones have been produced, as the upper line is situated at $0.008161, the middle line is at $0.007957, and the lower side is at $0.007753. The stochastic oscillators have succumbed to a southbound force, making them move from 40.391855 to 21.813535.
Is it prudent for traders to avoid taking long positions in the TAMA/USD market at this time due to the price’s present features near the lower Bollinger Band?
The present pushing pace of declining force has been on a slow-and-steady form to denote the need for investors to continue acquiring positions as the TAMA/USD market stalls lowly underneath the point of $0.00800 at a close range, inclining rises.
As there have been conditions showcasing that falling pressures have relatively come with a rebounding input from value lines toward the $0.007500 will allow buyers to recoup stances from desirable lower-trading spots. A reasonable buying entry will be created by a decline against the lower Bollinger Band trend line and a prompt rallying force that delays the spot.
TAMA/USD Short-term chart
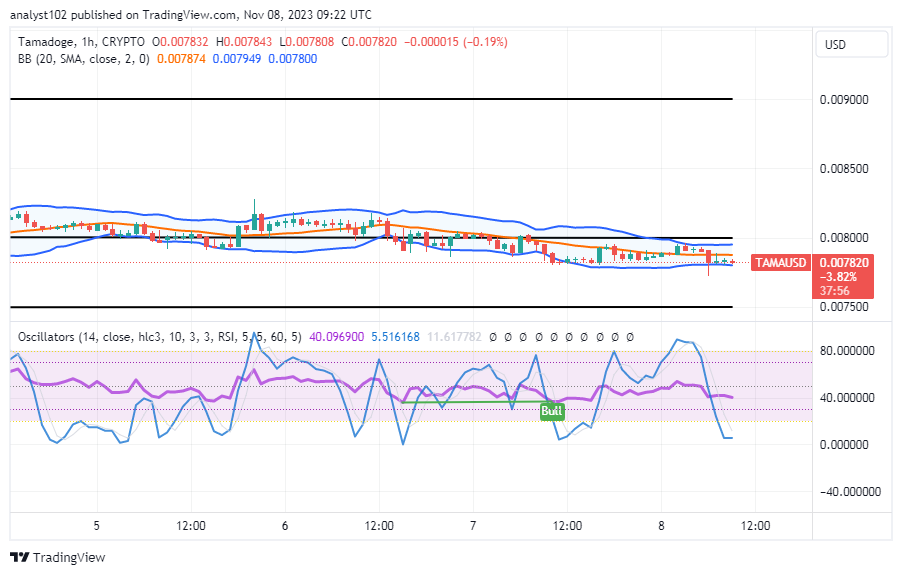
The TAMA/USD short-term chart reveals the crypto market stalls lowly underneath the line of $0.00800, inclining rises from around the lower Bollinger Band trend line.
The Bollinger Band trend lines are oriented southward, maintaining values between $0.007949 and $0.007874, with the lower limit at $0.007800, respectively. The southern positions of the stochastic oscillators are 40.096900 to 5.516168. An indicator emerged throughout yesterday’s sessions, suggesting that the forces of insurrection may soon reappear.
“Knowledge is power,” but in this instance, it’s also a pass to more money and improved aim. Become more intelligent right now at the pet store!
Stat Attack: Intelligence 💡
— TAMADOGE (@Tamadogecoin) November 7, 2023
‘Knowledge is power,’ but in this case, it’s also a ticket to better aim and more coins. Upgrade your intelligence in the Pet Store today!
Try it now on Tamadoge Arcade 👇
📱 Android: https://t.co/3PXpfUBjQh
📱 iOS: https://t.co/UN5MlRGOTC pic.twitter.com/PqWjOetNZq
Do you want a coin that would 100X in the next few months? That is Tamadoge. Buy TAMA today
Note:Forexschoolonline.com is not a financial advisor. Do your research before investing your funds in any financial asset or presented product or event. We are not responsible for your investing results.


Leave a Reply