Tamadoge Price Prediction – September 13
Over a couple of trade successions between buyers and sellers in the market operations engaging Tamadoge and the US Coin, the crypto trade springs up from around $0.01000, reverting to a pause moment around the point of $0.01100.
As a trader, keeping up with the price activity at any given time can be a difficult undertaking that frequently calls for much effort. However, with time and a mindset that understands how to apply the reward-risk ratio principle, positions will be protected against excessive loss and greed. With these technical considerations, long-position takers in the TAMA/USD market are instructed to run their entries on a long-term basis, regardless of how long it will take them to return to higher pushes above the points they have already gained from ups and downs this year
TAMA/USD Market
Key Levels
Resistance levels: $0.01200, $0.01250, $0.01300
Support levels: $0.009500, $0.009000, $0.008500
TAMA/USD Medium-term Chart
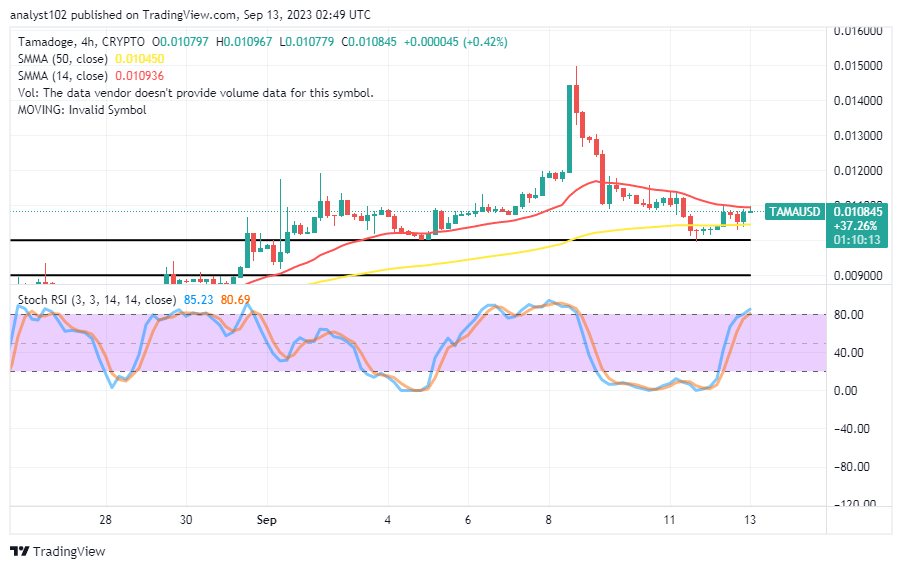
The TAMA/USD medium-term chart shows the crypto market springing up while it tested a support around $0.01000 before reverting to a tight pause around the point of $0.01100.
The current arrangement pattern between the indicators shows that bulls are not succumbing to an unnecessary downward shift as the 14-day SMA is positioned at $0.010936 above the $0.010450 value line of the 50-day SMA. The stochastic oscillators have stretched northbound to stay between 80.69 and 85.23, denoting that the price is pushing for a final move.
Should sellers begin placing orders right away, given the stochastic oscillators’ current reading posture on the TAMA/USD market?
Tamadoge coin being an emerging crypto economy, it would be early to take any position contrary to its value in favor of the US currency at this moment, given that the price springs up from a low of $0.01000 up back to a psychological point of $0.011000, reverting to a pause around it as of the time of this piece.
Executing lingering orders is still seen as the best course of action for enabling the restaurants to operate on a long-term basis, according to a brief analytical bias for northward-position pushers. A decrease from the two points mentioned in the previous sentence will, in general, result in recovering at a less beneficial price before swinging back to the moon side.
TAMA/USD Short-term chart
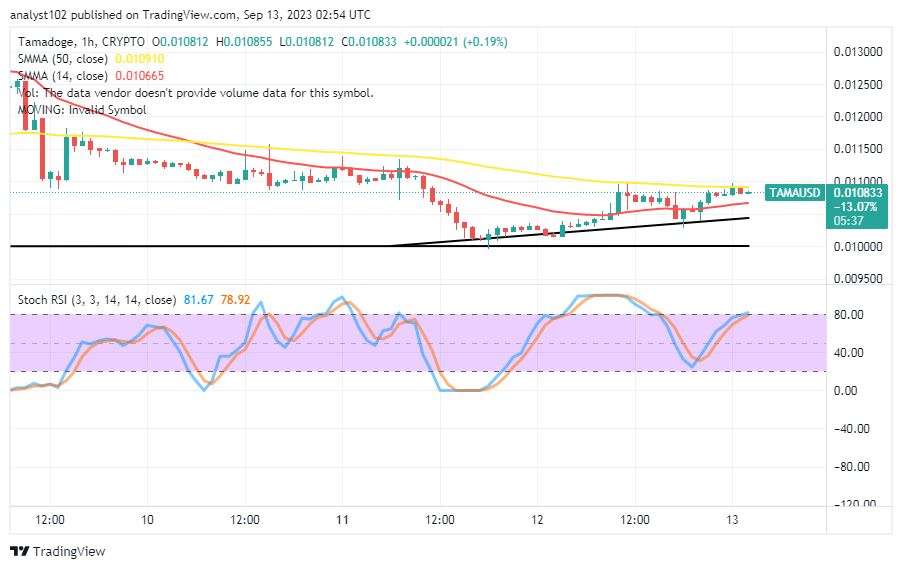
The TAMA/USD short-term chart shows the crypto market springing up from around the point of $0.01000 before reverting to a pause condition.
The 14-day SMA indication is closely positioned beneath the 50-day SMA indicator, which has moved northward to suggest upward. They are currently anywhere between $0.01100 and $0.01050. A determined advance toward getting greater values for either of the two points, favorably or negatively, will result from active trading activity against either of the two points. From 78.92 to 81.67, the Stochastic Oscillators are roughly positioned southward. Before taking any action, traders should be on the lookout for what the expected price movement will presage.
We’ll put the money earned from your booster purchases and credit usage in our games directly into our burn gateway. Amadoge (TAMA/USD) Market Springs Up, Reverting to a Pause
Play and Burn 🔥
— TAMADOGE (@Tamadogecoin) September 12, 2023
Every time you buy a booster or use credits in our games we’ll add the revenue to our burn portal.
Download our latest game Tamadoge Arena to get burning 👇
📱 Android: https://t.co/INCaGendE4
📱 iOS: https://t.co/Fj9tT5Oicu pic.twitter.com/u0RY6Nx9ck
Do you want a coin that would 100X in the next few months? That is Tamadoge. Buy TAMA today
Note:Forexschoolonline.com is not a financial advisor. Do your research before investing your funds in any financial asset or presented product or event. We are not responsible for your investing results.


Leave a Reply