Tamadoge Price Prediction, January 1
There has been a long range of price movements in the business activities of Tamadoge versus the purchasing weight of the US coin as the current financial situation sets lowly, keeping the index rising.
The modest movements that the market is executing indicate that the price is gathering momentum from lower-range areas, which may be progressively extended through a little amount of negative space. And it would be wise for investors to keep placing buy-position orders if that notion tends to come true. Position-longing directives should be followed to a fair degree without inciting fear.
TAMA/USD Market
Key Levels
Resistance levels: $0.0090, $0.0100, $0.0110
Support levels:$0.0075, $0.00700, $0.0065
TAMA/USD Medium-term Chart
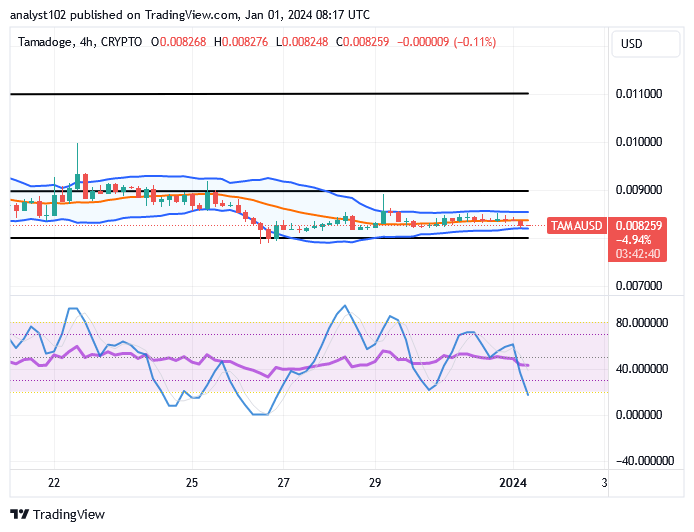
The TAMA/USD medium-term chart reveals that the crypto market sets lowly and keeps the index rising within the range boundaries of $0.00900 and $0.00800.
The formation outlook of the indicators is positioned to showcase that selling activities are on the reduction impulse pace, given that the Bollinger Bands are being southerly stretched briefly above the point of $0.00800. The stochastic oscillators are in a southward placement mode, slowly penetrating the oversold region. That shows the market is going to gain a stance, possibly in the near future.
Which direction is the TAMA/USD market now moving in terms of price movement?
The present transaction situation portends that the price is still trading sideways at a lower end zone, given that the crypto-economic market is setting lowly, which keeps the index closely above the point of $0.00800.
From about the $0.00800 mark, a line of believable decreasing velocities has been showing signs of allowing long-position placers to reclaim their positions. We anticipate that regardless of how long it takes for the price to rise again, buyers should keep accumulating points. When greater resistance signals an upturn in the market, buyers should exercise caution when entering the market suddenly. This feeling suggests that it is psychologically best for investors to develop the notion of buying at the bottom.
TAMA/USD short-term chart
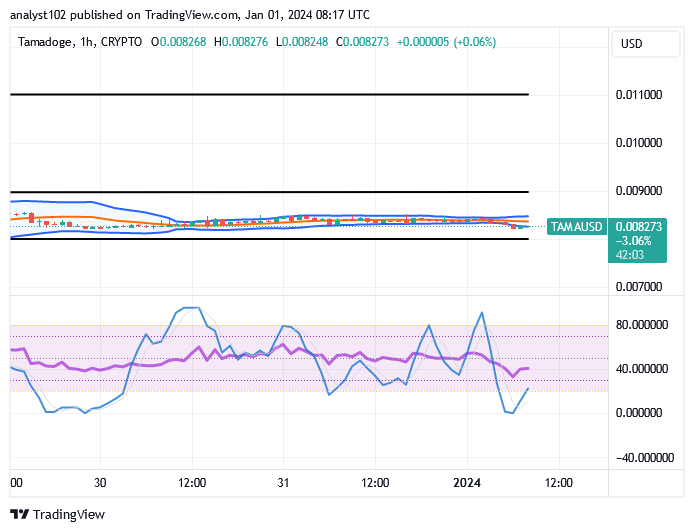
The TAMA/USD short-term chart shows the crypto-economic market sets lowly and keeps the index rising above the line of $0.00800.
The Bollinger Band indications have been moving toward the east between the $0.00900 and $0.00800 marks. The blue line is in the oversold area because the stochastic oscillators are crossing southward. The stage has been progressively created for shopping sprees to undergo reform before witnessing subsequent aggressive rising forces. Traders should therefore think about buying rather than selling.
Player vs. player in Tamadoge Arena is happening right now.
Bet credits and beat your opponent—the winner takes it all!
Tamadoge Arena player vs player mode is LIVE 💥
— TAMADOGE (@Tamadogecoin) December 31, 2023
Wager credits & outscore your rival – winner takes all! 🏆
Download on iOS & Android now 👇
📱 Android: https://t.co/dB4zatlCdy
📱 iOS: https://t.co/PiDAjnDmaZ pic.twitter.com/m03r3Xfjha
Do you want a coin that would 100X in the next few months? That is Tamadoge. Buy TAMA today
Note:Forexschoolonline.com is not a financial advisor. Do your research before investing your funds in any financial asset or presented product or event. We are not responsible for your investing results.


Leave a Reply