Tamadoge Price Prediction – May 2
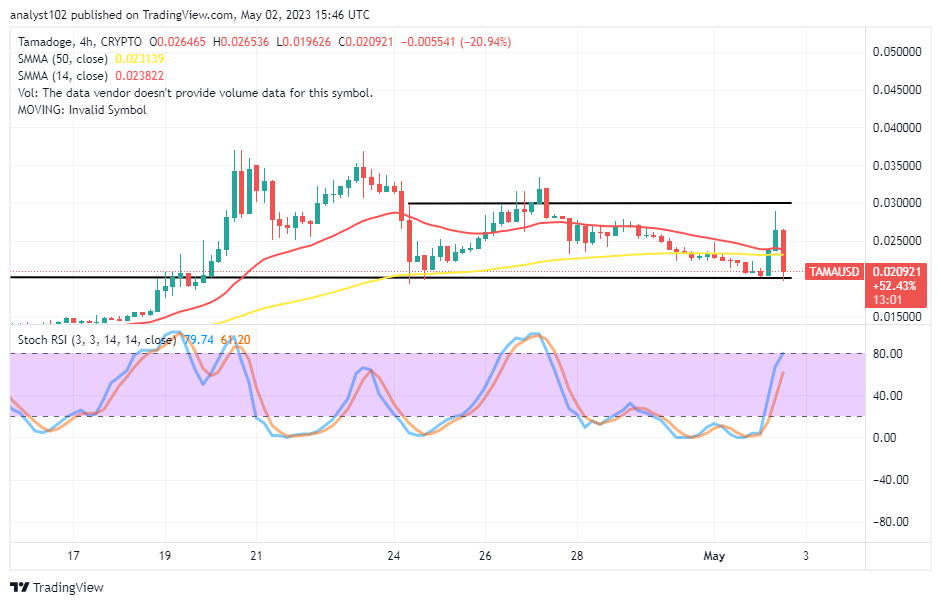
There has been a re-occurrence session in the TAMA/USD trade operations as the crypto-economic market reversed to rebuild a rebound around the support trading of $0.02000. The last morning trading hours saw vibrant upsurges toward the resistance point of $0.03000 before embodying between $0.026536 and $0.019626 trading line zones at a negative percentage rate of 20.94. The falling motion could obstruct the approach of high-lot-size customers, taking long positions by causing an unneeded panic sell-off.
TAMA/USD Market
Key Levels
Resistance levels: $0.02500, $0.02750, $0.03000
Support levels: $0.01750, $0.01500, $0.01250
TAMA/USD – 4-hour Chart
The TAMA/USD 4-hour chart reveals the crypto-economic market reverses to rebuild a rebound trading cycle around the support level of $0.02000, as the $0.01750 could be in the process of serving as an extension of that assumption fails to maintain a positive stance. The 14-day SMA indicator is at the $0.023822 value line above the $0.023139 line of the 50-day SMA indicator. The Stochastic Oscillators have swung northbound from a lower level to 61.20 and 79.74. A bearish trading candlestick is in place to decimate some of the valuation increases obtained back to the base zone.
Should buyers hold off on taking positions after the TAMA/USD market’s current bearish trading candlestick emerged?
As the TAMA/USD market reverses to rebuild a rebound cycle, it should be seen as a normal phenomenon for a situation like this to occur in emerging trading instrument deals. In such a scenario, new investors will purchase at lower prices as the stock continues its downward trend. When the Stochastic Oscillators are in the lower levels and pointing upward, it is imperative for long-position takers to make back their stances.
On the downside of the TAMA/USD technical analysis, it indicated that sellers’ degree of responsiveness to the present declining motion could cause the price to push slightly more lowers around the $0.02000 level, especially if bulls lack the energy to quickly retard the gravity. To reach points between the last two support levels of $0.01500 and $0.01250, bears on the part must step up their attempts to use the downward force.
TAMA/USD 1-hour chart
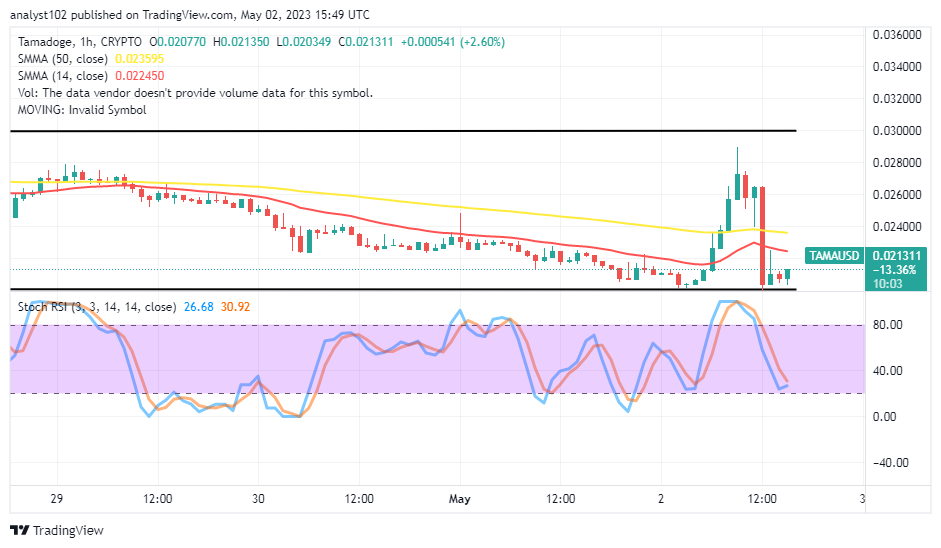
The TAMA/USD 1-hour chart clearly shows the crypto-economic market reverses to rebuild a rebound around the same zone of $0.02000 level where it began the previous swinging process to the upside. The 14-day SMA indicator is at $0.022450 beneath the $0.023595 value line of the 50-day SMA indicator. The Stochastic Oscillators have moved southbound toward the 20. However, they are seemingly attempting to close to the north 26.68 and 30.92 with two smaller bullish candlesticks formed over the past three hours over a range close to the value point initially mentioned in this analytics paragraph.
Forget about Babydoge, TAMA is winning! In the coming days, it will be listed on top CEXs.
https://twitter.com/Tamadogecoin/status/1653398832523145219/photo/1
Do you want a coin that would 100X in the next few months? That is Tamadoge. Buy TAMA today
Note: Forexschoolonline.com is not a financial advisor. Do your research before investing your funds in any financial asset or presented product or event. We are not responsible for your investing results.


Leave a Reply