Tamadoge Price Prediction – May 4
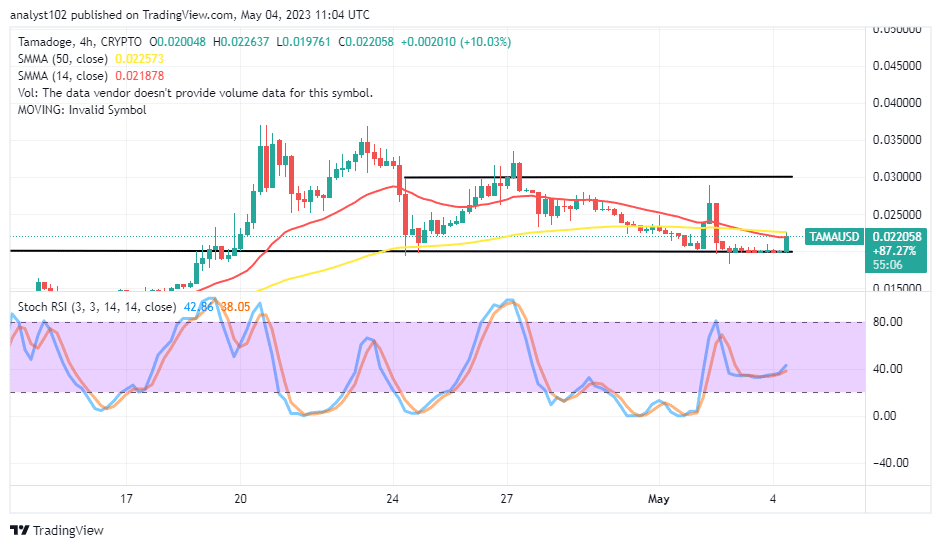
After a line of several failing fall-off trading moments around the psychological line of $0.02000, the TAMA/USD market has been able to reclaim an uprising session. Price is moving northward at a positive 10.03 percentage rate, allowing the buying frenzy to flourish between the trading ranges of $0.019761 and $0.022637. The road to regaining lost momentum currently remains narrow.
TAMA/USD Market
Key Levels
Resistance levels: $0.02500, $0.02750, $0.03000
Support levels: $0.01750, $0.01500, $0.01250
TAMA/USD – 4-hour Chart
The TAMA/USD 4-hour chart showcases the crypto market reclaiming an uprising session as bears failed to intensify efforts hovering around the $0.02000 support level. A bullish-trading candlestick is in the beefing mode to touch the axis of the SMAs. Specifically, the 14-day SMA indicator is at a $0.021878 value below the $0.022573 line of the 50-day SMA indicator. The Stochastic Oscillators have successfully swung back northward from below 40 to 38.05 and 42.86 simultaneously and gradually.
Will the current bullish candlestick’s appearance concerning the SMAs be sufficient to serve as the basis for opening positions to buy?
The current emergent bullish candlestick would serve as a backing signal wall toward getting sustainable ups as the TAMA/USD market reclaims an uprising session. Any moment that an active motion follows the existing northward gravitational forces, buyers should be prompt by completing quick desiring orders. In the process of that sentiment materializing, bulls will have to be wary of jumping abruptly after the moves rise beyond or toward the resistance level of $0.03000 afterward.
On the downside of the TAMA/USD technical analysis, bears should outrightly stay off the market until either a convergence or a sharp reversal motion is against some of the anticipatory overhead resistances before going for a selling order. The rules of money management must always abide by when making trading decisions.
TAMA/USD 1-hour chart
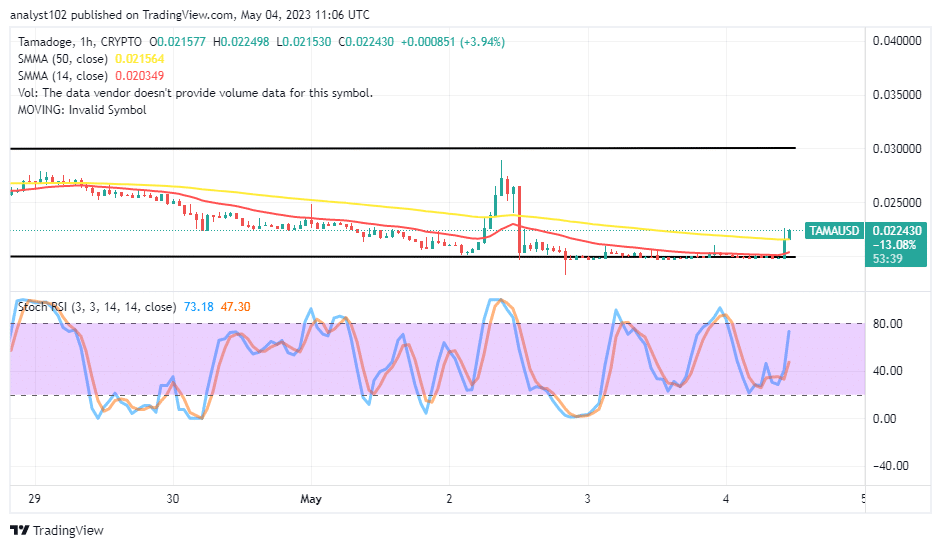
In the last two hours running, this analytics write-up, the TAMA/USD 1-hour chart shows the crypto trade reclaims an uprising session from the $0.02000 baseline, breaking through the trend lines of the SMAs. The 14-day SMA indicator is at $0.020349, underneath the $0.021564 value line of the 50-day SMA indicator. The Stochastic Oscillators are in the mood of northbound-crossing mode from 20 and 40 to 47.30 and 73.18. That shows Tamadoge’s business operations will potentially prevail further in the next several hours.
Forget about Babydoge, TAMA is winning! In the coming days, it will be listed on top CEXs.
https://twitter.com/Tamadogecoin/status/1653374559079342080/photo/1
Do you want a coin that would 100X in the next few months? That is Tamadoge. Buy TAMA today
Note: Forexschoolonline.com is not a financial advisor. Do your research before investing your funds in any financial asset or presented product or event. We are not responsible for your investing results.


Leave a Reply