Tamadoge Price Prediction – August 24
Tamadoge market operation raises base from a lower-trading spot to around $0.008000, as the cryptocurrency connotes hikes against the valuation of the US monetary trading instrument.
A partial imaginary line connecting a lower trading range of $0.007500 to $0.008000 has been seen. After that promising bullish trend began, the price dropped to a low of $0.00808 and is currently trading at $0.008142, maintaining a minute percentage rate of 0.95. Even when there is a strong likelihood of falling force, purchase orders should always be maintained.
TAMA/USD Market
Key Levels
Resistance levels: $0.009000, $0.009500, $0.010000
Support levels: $0.007500, $0.006500, $0.005500
TAMA/USD Medium-term Chart
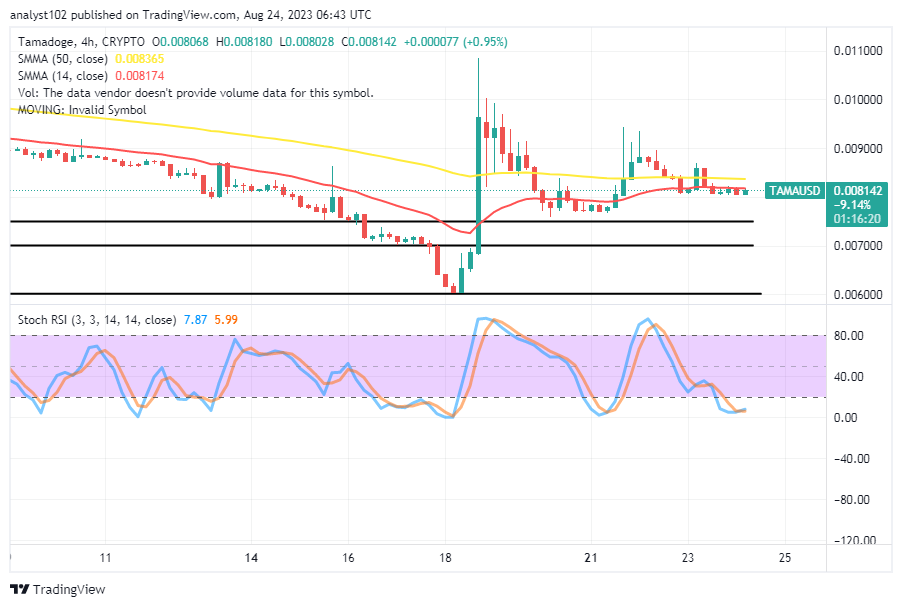
The TAMA/USD medium-term chart showcases the crypto-economic market’s rising base and connotes hike signs from around the psychological trade zone of $0.008000.
The 50-day SMA indicator is at $0.008365, which is above the $0.008174 value line of the 14-day SMA indicator. The two horizontal lines drawn at $0.007000 and $0.007500 are serving as the critical underlying support zones. The stochastic oscillators have pulled southerly back into the oversold region, moving from 5.99 to 7.87. That denotes a buying moment is on the card as of writing.
In regard to other indicators, what trade posture does the TAMA/USD market’s current candlestick structure represent?
Technically, considering the trade pattern of Tamadoge versus the US Dollar, variant candlesticks have formed to closely bottom on the zone of the $0.008000, showing that the crypto market raises base from around the $0.007500 and connotes hikes imputed.
From the perspective of closing psychological trade analytics, long-position taking traders must focus their efforts on making sure that at no point is a southerly breaking move permitted between the marks of $0.00800 and $0.007500. If, however, that assumption turns out to be untrue, investors and buyers alike shouldn’t give a damn and delay the market out of fear. 
TAMA/USD Short-term chart
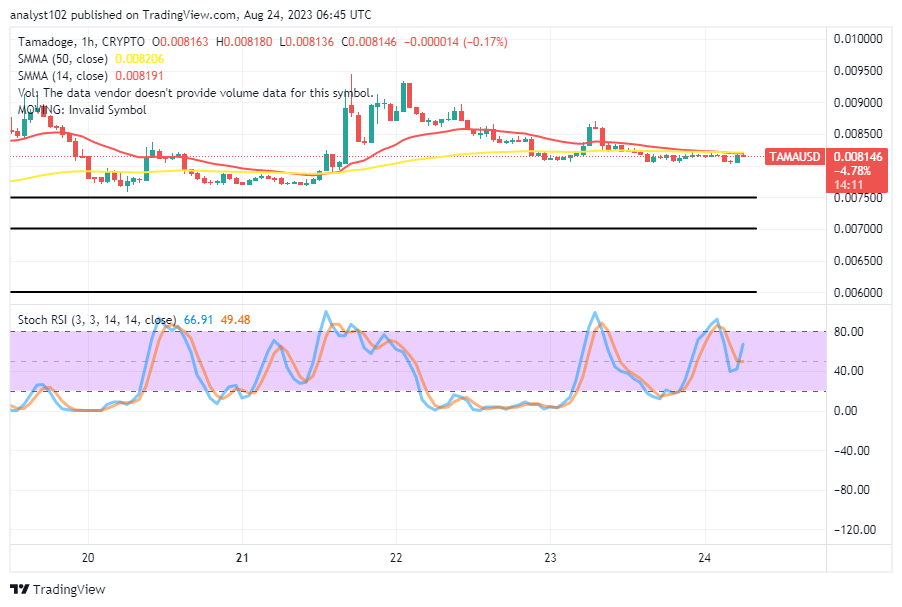
The TAMA/USD short-term chart showcases the crypto market’s rising base, and it connotes rising traits nearly underneath the trend lines of the moving averages.
An intersection of the 50-day SMA indicator and the 14-day SMA indicator has marked a line of points between $0.008206 and $0.008191. The values of the stochastic oscillators range from 49.48 to 66.91. A pause has been present recently, indicating that buyers may need to be patient while a bearish smaller candlestick is undergoing a minor correction. However, new purchasers or investors should hold off on investing in the cryptocurrency market at this time.
We’ve heard that Paris is beautiful right now.
We hear Paris is lovely this time of year 🇫🇷#P2E #NFT #ComingSoon pic.twitter.com/o1pYQPgeUT
— TAMADOGE (@Tamadogecoin) August 23, 2023
Do you want a coin that would 100X in the next few months? That is Tamadoge. Buy TAMA today
Note: Forexschoolonline.com is not a financial advisor. Do your research before investing your funds in any financial asset or presented product or event. We are not responsible for your investing results.


Leave a Reply