Tamadoge Price Prediction – May 12
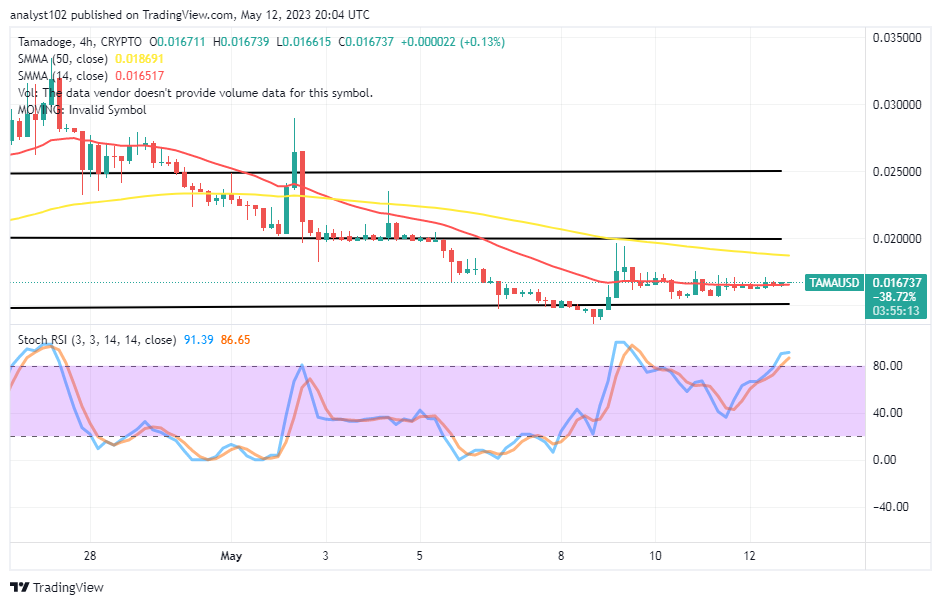
There has been a continual low-active push between the two price pushers as the TAMA/USD market moves sideways, getting set for ups with hopes in the course. The lower rises and decreases have weakly featured between $0.016615 and $0.016739 values. Transaction fluctuations between the matching trade instrument are unlikely to have a significant enough impact to provide a clear direction path.
TAMA/USD Market
Key Levels
Resistance levels: $0.02000, $0.02250, $0.02500
Support levels: $0.01250, $0.01000, $0.00750
TAMA/USD – 4-hour Chart
The TAMA/USD 4-hour chart showcases the crypto market moves sideways, getting set for ups above the $0.01500 support level. Two horizontal lines have been drawn to mirror the crypto’s valuation and have caged between $0.02000 and $0.01500. The 14-day SMA indicator is underneath the 50-day SMA indicator. And they are in those points. The Stochastic Oscillators have tried to swerve northbound into the overbought region, maintaining 86.65 and 91.39 points to signify that the uprising force is reaching for a quick height pressure.
What is the pushing pace like between the TAMA/USD market movers at the moment?
It could be that pushes in the TAMA/USD trade operation will remain less attractive, given that the crypto-economic market moves sideways, getting set for ups over the baseline of $0.01500. However, if the circumstance turns out to be the essential breachable line before reclaiming back to the upside, the support level to that position has been $0.01250.
On the decreasing direction of the TAMA/USD technical analysis, sellers might have to await the emergence of an active reversal that could follow a significant rising in the worth of the crypto to a high zone before starting to launch a shorting order. The upper range line must play an essential part in the process.
TAMA/USD 1-hour chart
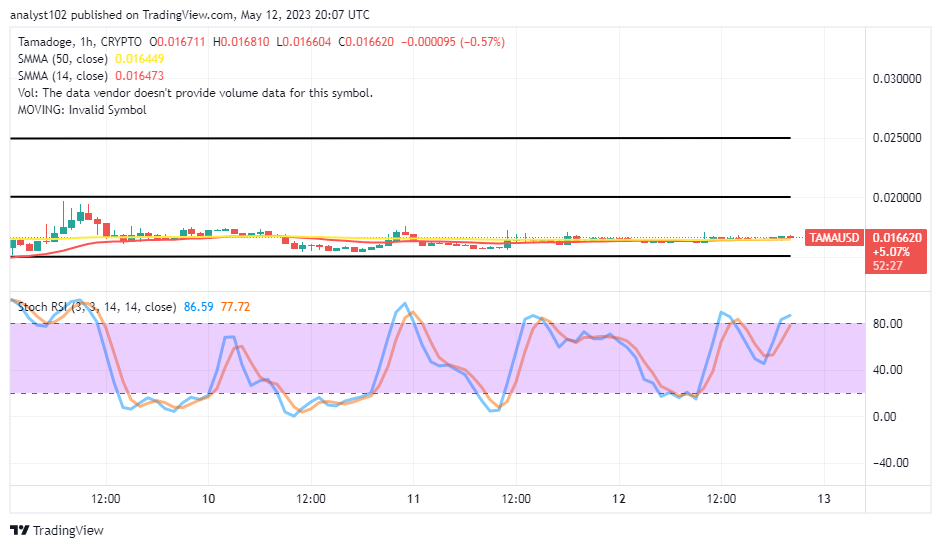
The TAMA/USD 1-hour chart reveals the crypto market moves sideways, getting set for ups on a promissory signal note predominantly around the SMA trend lines. The 14-day SMA indicator has been tightly trending eastwardly alongside the 50-day SMA indicator as the trading candlesticks feature ups and downs in smaller forms. The Stochastic Oscillators have briefly moved into the overbought region at 77.72 and 86.59 levels. And they are tempted to close the lines to suggest that a pause session will prevail.
Forget about Babydoge, TAMA is winning! In the coming days, it will be listed on top CEXs.
Do you want a coin that would 100X in the next few months? That is Tamadoge. Buy TAMA today
Note: Forexschoolonline.com is not a financial advisor. Do your research before investing your funds in any financial asset or presented product or event. We are not responsible for your investing results.


Leave a Reply