Tamadoge Price Prediction – June 20
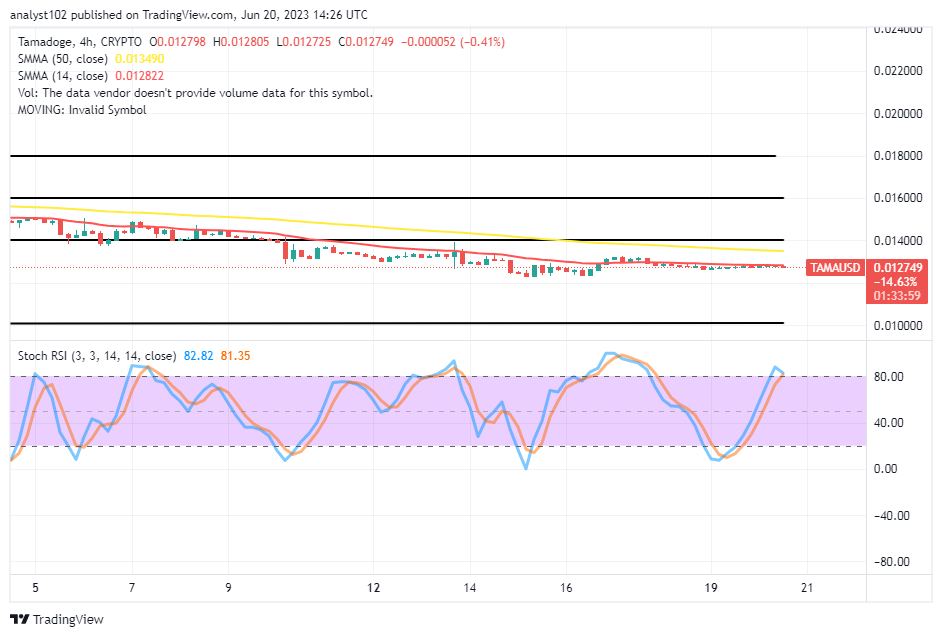
The impact of sellers has been somewhat active in the TAMA/USD trade transactions as the crypto-economic market moves in a narrow range, settling for a bounce. Going by that trade trait, the financial book of records has it that buying and selling moments are featured between $0.012805 and $0.012725 value lines at an average minute percentage rate of 0.41 negative.
Our technical verdict remains that buyers should continue to hold to their positions pending the presumed soaring motions in the emerging crypto economy versus the US coin in the long run.
TAMA/USD Market
Key Levels
Resistance levels: $0.01500, $0.01600, $0.01700
Support levels: $0.01200, $0.01100, $0.01000
TAMA/USD – 4-hour Chart
The TAMA/USD 4-hour chart shows that the crypto-economic market moves in a narrow range, settling for a bounce as long as the force to enable bears to push southward cannot break down the support level at $0.01200. The 14-day SMA indicator has the propensity to give a negative signal on the candlesticks that have been forming below the $0.013490 value line of the 50-day SMA indicator. The Stochastic Oscillators have briefly shifted northbound into the overbought region to keep the positions of 82.82 to 81.35, indicating that there might soon be a gravity release to the downside in no time. 
In the long run, are there more ways to create lows below the 14-day SMA of the TAMA/USD market?
In the wake of seeing the TAMA/USD market operations losing steadily against the $0.01200 in the long run, investors should take advantage of buying the presumed dipping session, given that the crypto market will be moving in a narrow range, settling for a bounce.
Furthermore, regarding the upside technical analysis, the path to the downside against the support level of $0.01200 should not breach freely before giving back to the capacity of rebounding nature in the process. The Stochastic Oscillators’ current reading indicates that some care must be taken into consideration to ensure that they are reset to lower positions before considering a good buy replacement order later.
TAMA/USD 1-hour chart
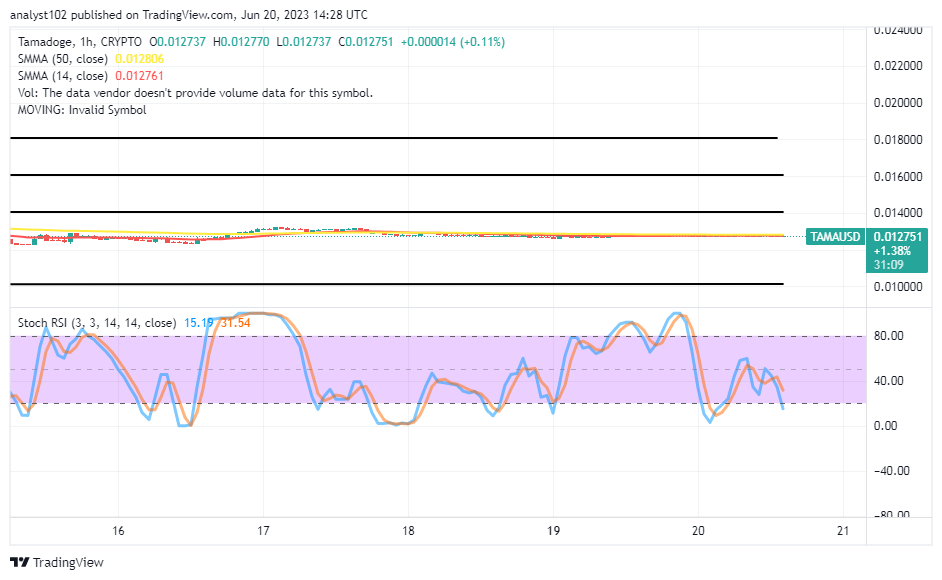
The 1-hour chart showcases the crypto-economic market is moving in a narrow range, settling for a bounce as indicated by the reading posture of the Oscillators in the short-term running outlook.
The trending arrangement between the 14-day SMA indicator and the 50-day SMA indicator has been that tightly tinier moves have surfaced to tender an indecisive moment alongside the transactions over time. The Stochastic Oscillators are around 31.54 to 1519 points, indicating the moves to the south side are gradually getting a reduction index. Therefore, buyers should continue to look for a good time to press the long button.
20 FREE credits to use in the top game on Web3? YUP
20 FREE credits to play the best game Web3 has to offer? YUP! 🚀✨
— TAMADOGE (@Tamadogecoin) June 20, 2023
Sign up here 👉 https://t.co/oQzq6xUqrW pic.twitter.com/3ojRzRTjVH
Do you want a coin that would 100X in the next few months? That is Tamadoge. Buy TAMA today
Note: Forexschoolonline.com is not a financial advisor. Do your research before investing your funds in any financial asset or presented product or event. We are not responsible for your investing results.


Leave a Reply