Tamadoge Price Prediction – October 10
Sequence to a significant falling force in the bargaining operations of Tamadoge versus the valuation of the US Dollar, as the crypto market precipitates closer to the line of $0.008000, searching for bounces.
Financial data obtained from the daily chart shows that bears’ impacts may still be present, giving early rebounding motions a small opportunity to succeed. Based on what the medium-term reading chart is currently displaying, buyers may begin buying back. The risk of further depreciation should not be ignored as long-term position-takers emerge for action.
TAMA/USD Market
Key Levels
Resistance levels: $0.009000, $0.009500, $0.01000
Support levels: $0.007500, $0.007000, $0.006500
TAMA/USD Medium-term Chart
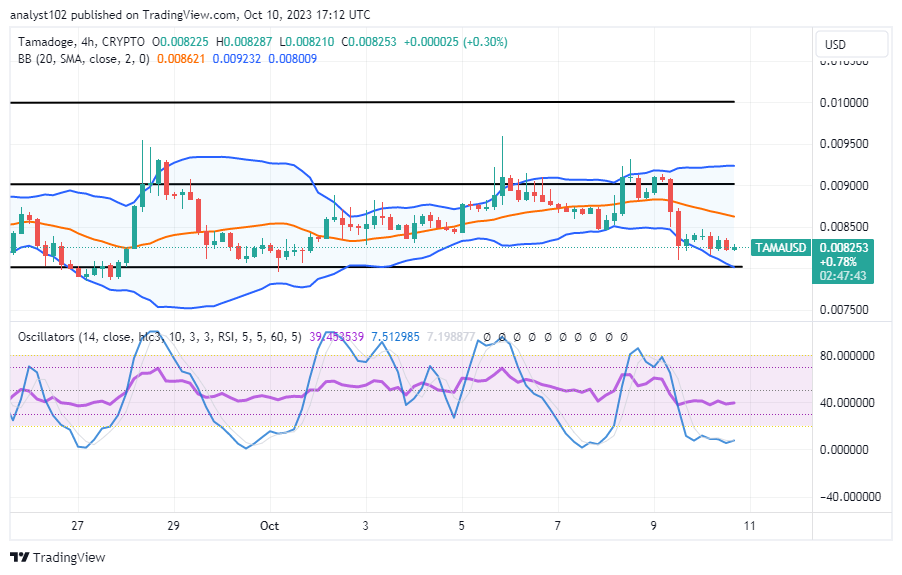
The TAMA/USD medium-term chart reveals the crypto-economic market precipitates closely above the trend line of the lower Bollinger Band, searching for bounces.
The upper Bollinger Band is at $0.009232, the middle part is at $0.008621, and the lower Bollinger Band is at $0.008009. At this time of technical piece, a smaller 4-hour candlestick shows a bullish signal to make a note against seeing further free fall-offs. The stochastic oscillators have dipped into the oversold region, positioning downward from 39.453539 to 7.512985 values.
What is the trading line of imminent resistance that buyers will be battling against in the area of the lower Bollinger Band of the TAMA/USD?
The trade point of $0.008500 will serve as the key resistance to the present trade level of the TAMA/USD market, given that the crypto-economic market precipitates toward the lower Bollinger Band, searching for bounces.
A string of lower lows that have been recorded during the past few hours show that selling forces are in a less active pushing posture. Transaction lines below $0.009000 are regarded as good plunging purchase spots in advance of anticipated bounces due to the way things have historically been. We believe that significant breakout motions to the north are imminent. Therefore, sellers shouldn’t encourage holding onto any shorting entry opportunities they may receive at a specific moment for too long.

TAMA/USD Short-term chart
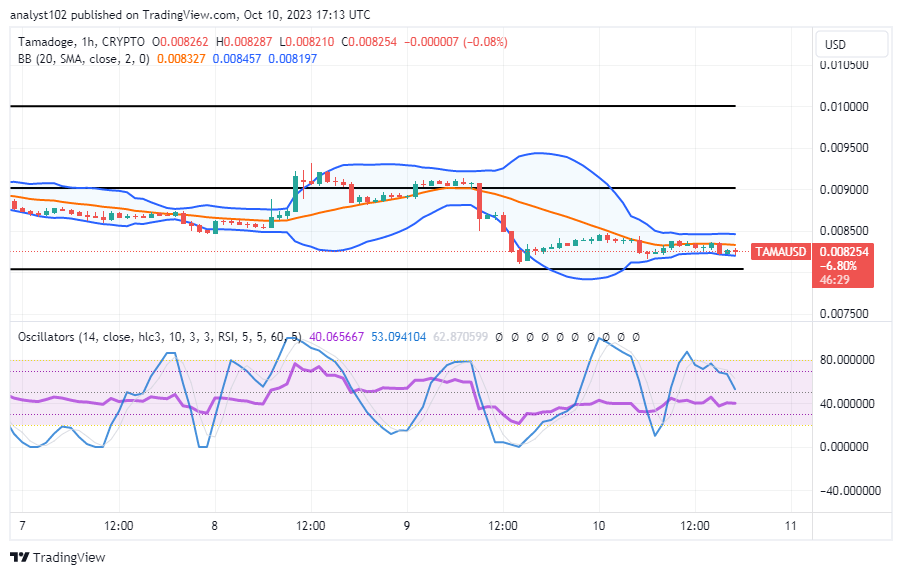
The TAMA/USD short-term trade chart showcases the crypto-economic market precipitating between the lines of the middle and lower Bollinger Bands, searching for bounces.
The Bollinger Bands can be seen on the 1-hour chart at $0.008457, $0.008327, and $0.008197, respectively. The stochastic oscillators are briefly pointing from 53.094104 to 40.065667 in a southerly direction. Longing position orders should be followed, especially on the part of investors, regardless of any additional factors that could lead to the price falling any further.
Play five classic games in the Tamadoge Arcade to win $TAMA.
Play to earn $TAMA across five classic games in Tamadoge Arcade 👾
— TAMADOGE (@Tamadogecoin) October 10, 2023
Download on mobile 👇
📱 Android: https://t.co/3PXpfUAM0J
📱 iOS: https://t.co/UN5MlRGh44 pic.twitter.com/ePYT82o2dR
Do you want a coin that would 100X in the next few months? That is Tamadoge. Buy TAMA today
Note:Forexschoolonline.com is not a financial advisor. Do your research before investing your funds in any financial asset or presented product or event. We are not responsible for your investing results.


Leave a Reply