Tamadoge Price Prediction – May 22
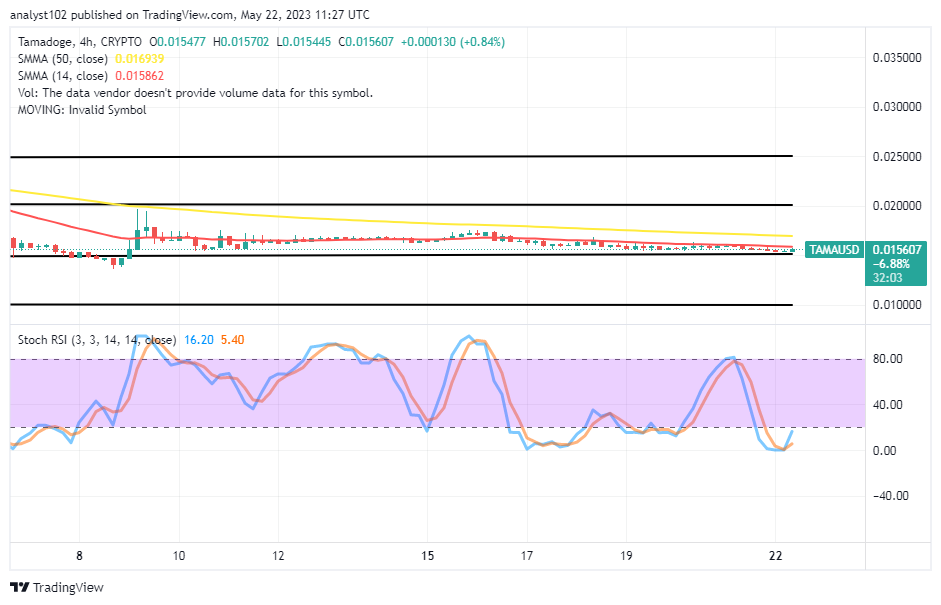
The manner of trading operations in the TAMA/USD trade show that the crypto market keeps sideways with a rallying sign closely above the baseline of $0.01500. Price begins to make slight positive changes from a low point of $0.015445 at an average minute percent of 0.84. The trading outlook’s capacity portends that buyers are garnering catalysts to surge even if the same eastward long-trading path may not breach horribly. Whatever the reading formation of the trading tools considerably to the current lower-trading spot, buying-related aptitudes have to uphold irrespective of any attempts to hold the price in the zone of even beneath it.
TAMA/USD Market
Key Levels
Resistance levels: $0.02000, $0.02250, $0.02500
Support levels: $0.01250, $0.01000, $0.00750
TAMA/USD – 4-hour Chart
The TAMA/USD 4-hour chart showcases the crypto-economic market keeps sideways with a rallying sign close to the $0.01500 line. The 50-day SMA trend line is above the 14-day SMA trend line. The Stochastic Oscillators have crossed northbound after touching the zero point to the position between 5.40 and 16.20 levels. Due to their inability to forcefully push southward against the $0.01500, sellers are on the verge of losing momentum.
What is the possibility of pushing lower lows beyond the TAMA/USD market at the $0.01500 level?
We believe the TAMA/USD’s $0.01500 market level will remain a tough baseline against sustainable further lower lows as the crypto market keeps with a rallying sign. Around the subject matter, buyers will probably engage in a dominating session. Bears should therefore refrain from attempting a comeback because doing so would imply a move to the negative. As long as the price remains around the value, and even if it intently manages to downsize will provide an opportunity of regaining buy orders in the long run.
TAMA/USD 1-hour chart
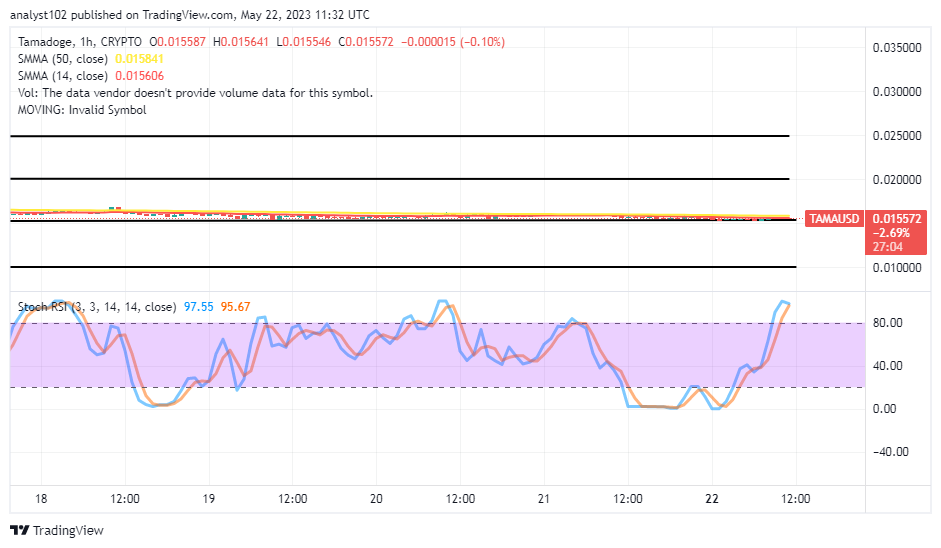
The TAMA/USD 1-hour chart reveals the crypto market keeps sideways with a rallying sign. In the last several hours in today’s session, the valuation of the former trading instrument has reached a high point, as indicated by the reading of the Oscillators. The SMA trend lines’ position has repeatedly confirmed that strong range motions are alongside the 14-day SMA and the 50-day SMA indicators. The Stochastic oscillators are in the overbought region, maintaining 97.55 and 95.67 levels to create a warning against the possibility of having a smooth northward push in the near time.
Forget about Babydoge, TAMA is winning! In the coming days, it will be listed on top CEXs.
https://twitter.com/Tamadogecoin/status/1653374559079342080/photo/1
Do you want a coin that would 100X in the next few months? That is Tamadoge. Buy TAMA today
Note: Forexschoolonline.com is not a financial advisor. Do your research before investing your funds in any financial asset or presented product or event. We are not responsible for your investing results.


Leave a Reply