Tamadoge Price Prediction – June 22
The TAMA/USD market is swinging high, striving for more as transaction operations have taken on a new dimension.
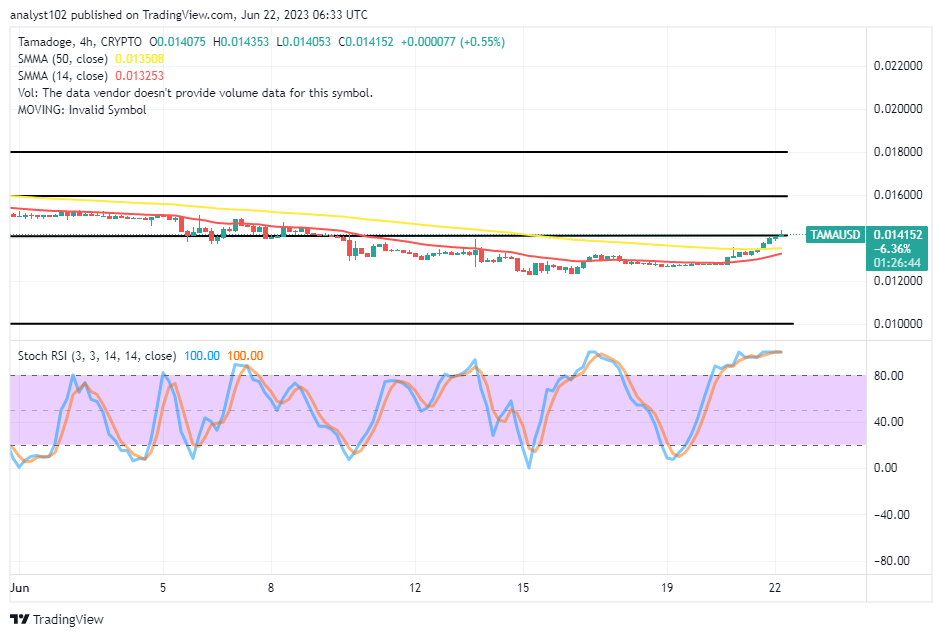
In the meantime, a sizeable degree of positivity has been recorded in the cryptocurrency’s valuation against the US currency between the $0.01400 and $0.01200 value lines. At this moment of technical piece, the price is trading around $0.014152 at a minutely positive percentage rate of 0.55. Buyers are gradually rising to their responsibilities toward creating a path through the north side.
TAMA/USD Market
Key Levels
Resistance levels: $0.01500, $0.01600, $0.01700
Support levels: $0.01200, $0.01100, $0.01000
TAMA/USD – 4-hour Chart
The TAMA/USD 4-hour chart showcases that the crypto-economic market is swinging high, striving for more potentialities in the subsequent operations over the trend lines of the SMAs. The 14-day SMA trend line is at $0.013253 below the $0.013508 value line of the 50-day SMA trend line. The Stochastic Oscillators have entered the overbought zone and are still conjoining to the north at 100 levels apiece, indicating that some degrees of caution needed to be.
Has there been a signal to propel further over the $0.01400 line in the TAMA/USD market, going by the current capacity trading outlook of rising?
The pace of spiraling motion in the valuation of Tamadoge against the US Dollar has been a gradual movement, even as we have it that the crypto market is swinging high, striving for more ups in the following sessions.
Bulls in the market have been slowly and steadily establishing their steps to the moon direction from over the support line of $0.01200. The most challenging thing in this technical piece is that the 50-day SMA indicator needed to cross northward by the 14-day SMA indicator to affirm the probable event that will project sustainable pushes through the resistances. However, if a correction happens along the way, it will be on purpose to allow investors to recover from less advantageous areas. That implies that the assumption shouldn’t raise any red flags in the case of a panic sell-off.
TAMA/USD 1-hour chart
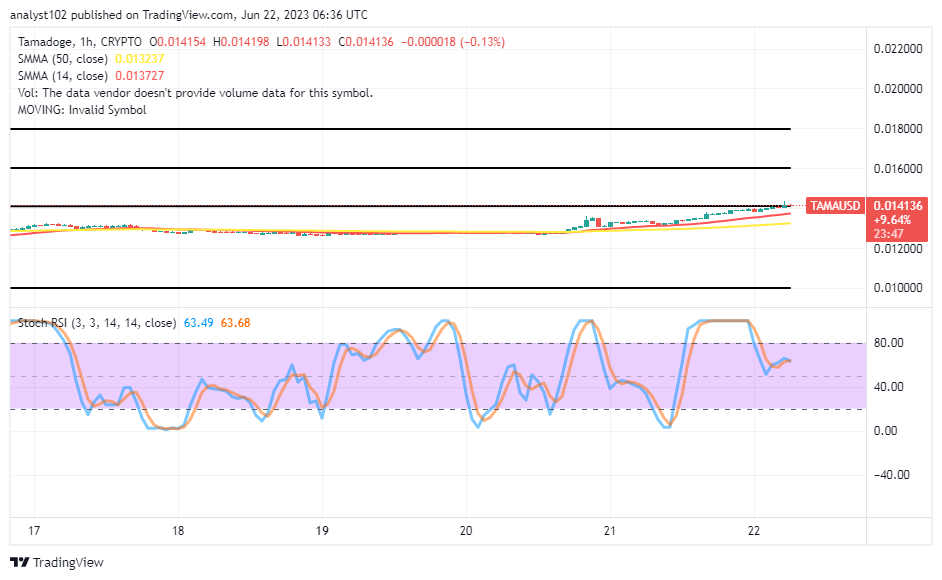
The 1-hour chart reveals that the crypto-economic market activity is swinging high, striving for more ups in the manner of rallying motion characterized by smaller candlesticks close to the buy signal side of the smaller indicator.
The 14-day SMA trend line is $0.013727 above the $0.013237 value line of the 50-day SMA trend line. The Stochastic Oscillators are have moved out of the overbought region to place around 63.68 to 63.49, signifying a warning signal against the possibility of having a smooth upward run in the crypto business. As a result, new prospective buyers or investors may be entering the market without the anticipation of seeing an increase within a few hours or days after this significant trading time.
Could you give your mother a P2E explanation? In that case, we created a little crash course.
Could you explain P2E to your mum? If not, we put together a little crash course.
— TAMADOGE (@Tamadogecoin) June 22, 2023
Read our blog about the basics of play-to-earn 👉 https://t.co/n1MbYVUDim pic.twitter.com/4fxxRAG77M
Do you want a coin that would 100X in the next few months? That is Tamadoge. Buy TAMA today
Note: Forexschoolonline.com is not a financial advisor. Do your research before investing your funds in any financial asset or presented product or event. We are not responsible for your investing results.


Leave a Reply