sTamadoge Price Prediction, March 22
Many promissory movements have continually been surfacing in the activities that mark up the levels of Tamadoge versus the valuation of the US coin, given that the crypto-economic market is rising, making a baseline.
The market’s bulls have been pushing prices upward, which has created impulses for the construction of strong foundations that will withstand most bear attempts to form. That presumption would hold true as long as the budding crypto economy’s valuation is still expressed in decimal terms.
TAMA/USD Market
Key Levels
Resistance levels: $0.012, , $0.014, $0.016
Support levels: $0.007, $0.006, $0.005
TAMA/USD Medium-term Chart
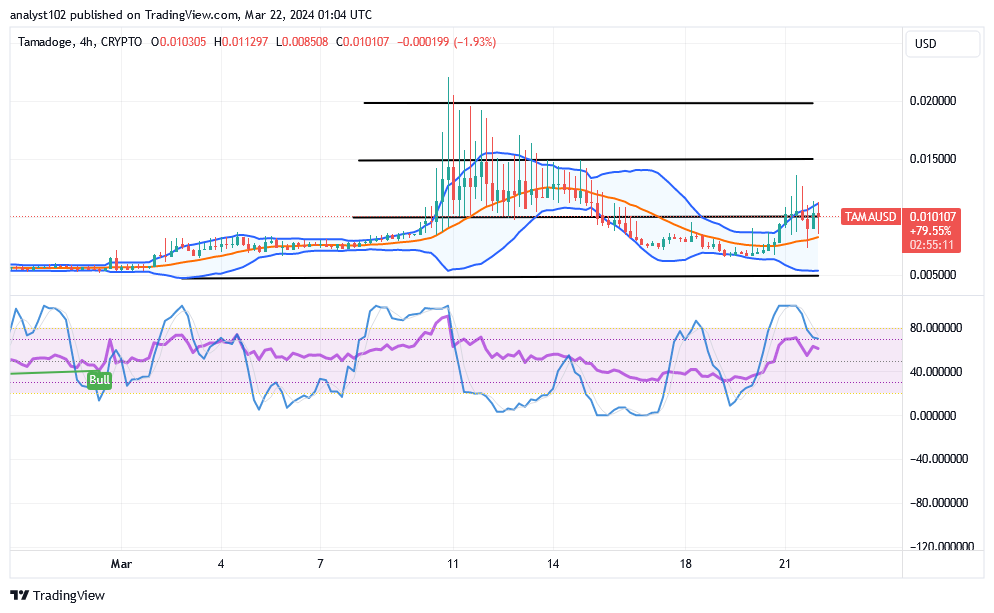
The TAMA/USD medium-term chart, as of the time of this piece, shows the crypto market is rising, making a baseline.
The positional status of the Bollinger Band trend lines has been made in such a way to signify that some rises are to feature at the upper part of the indicators. If bulls manage to add more muscles, the portion will get stretched considerably further. The stochastic oscillators have been swerving northbound to indicate that an atmosphere has been prepared against free falls.
Which trading line is viewed as the TAMA/USD market’s important downward point, as indicated by the Bollingr Bands?
From the technical perspective of the Bollinger Band indicators, the bargaining line of $0.005 appears to be the most crucial underlying point against single stable reductions in a scenario of intense draw-down, as the TAMA/USD market is currently rising, making a baseline.
Trade points that are close to the middle Bollinger Band trend line appear to indicate that bulls must maintain their energy-regaining mode at this initial support level before they can expect consistent bounce-offs. Nevertheless, no matter how long it takes, accumulating more points based on the investing strategy should never be ignored.
TAMA/USD short-term chart
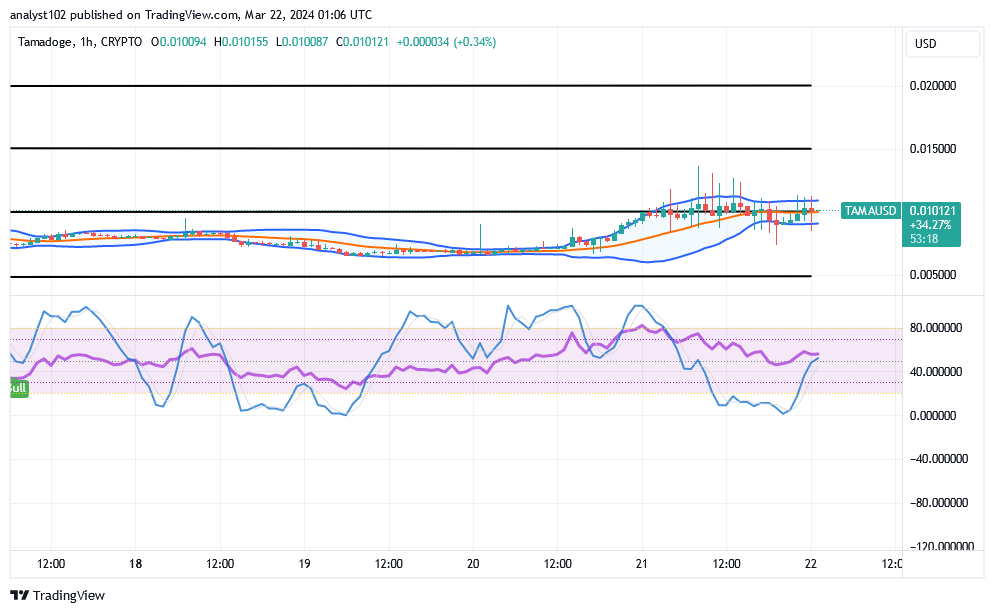
The TAMA/USD short-term chart showcases that the crypto market is rising, making a baseline in its path to the upside.
The market’s candlestick figures have been embodied in a large part of the Bollinger Band indicators. It is evident from the stochastic oscillators’ attempt to move back upward from an oversold area that a trend of increasing velocities has been ongoing. Consequently, investors ought to stick to their positions.
Let play-to-earn become your greatest power with Tamadoge Arcade!
Reach the highest score on five classic arcade games to claim your TAMA rewards.
Unleash the power of play-to-earn with Tamadoge Arcade! 🚀
— TAMADOGE (@Tamadogecoin) January 22, 2024
Score the highest on 5 classic arcade games and claim your $TAMA rewards 💰
📱 Android: https://t.co/3PXpfUAM0J
📱 iOS: https://t.co/UN5MlRGh44 pic.twitter.com/EtUYJ2LD8O
Do you want a coin that would 100X in the next few months? That is Tamadoge. Buy TAMA today
Note: Forexschoolonline.com is not a financial advisor. Do your research before investing your funds in any financial asset or presented product or event. We are not responsible for your investing results.


Leave a Reply