Tamadoge Price Prediction – August 29
Today’s activities in the market of Tamacoin against the valuation of the US Dollar, have continued to witness unstable up-rises, as the financial situation now has it that the crypto-economic market is receding actions and holds rise signs.
Because of the way the price has been reducing over a session, traders who want to focus too much on the movements are outside technical approach to trading. And, considering the level that the trade has been pull down; it’s shown that dip-buying method is supposed to be the best-ever thought irrespective of how further the presumed rebounds will be delayed.
Key Levels
Resistance levels: $0.0025, $0.0035, $0.0045
Support levels: $0.00075, $0.0005, $0.00025
TAMA/USD Medium-term Chart
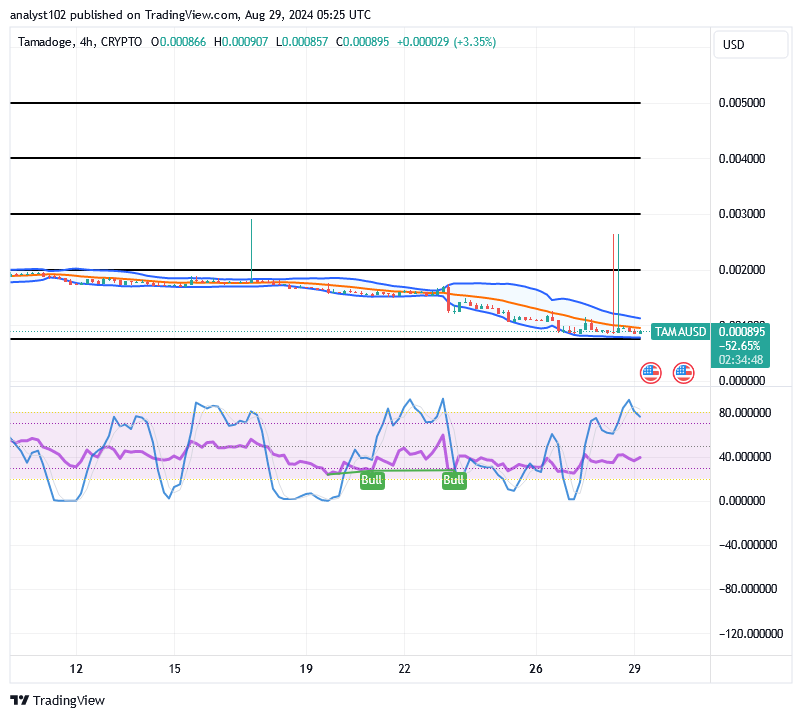
The medium-term TAMA/USD chart showcases the crypto-economic market is presently receding and holds rise signs.
The trend lines of the Bollinger Bands have been positioned southerly around the zones of the $0.001. The indicators are shielding vital lower trade spots that the market would be aiming to push out of ahead of observing a definite move. The stochastic oscillators have penetrated the overbought region.
Should traders be wary of joining the TAMA/USD trade in the Bollinger Bands?
It is of more technically inclining for traders to hold on to the system of dip buys and holding on the trade platforms that are not like MT4 and its likes or alike, as the TAMA/USD market is receding points and holds rise signs.
As there has sudden spiking situations with most time that the base zones use to get decimated in the long run has been attributed to fact that the emerging crypto instrument is still on its toward locating an ideal all-time low point before fearfully giving in back to stable bounce-offs. In keeping with that idea; the order prevailing bias is the accumulation of additional positions.
The TAMA/USD short-term
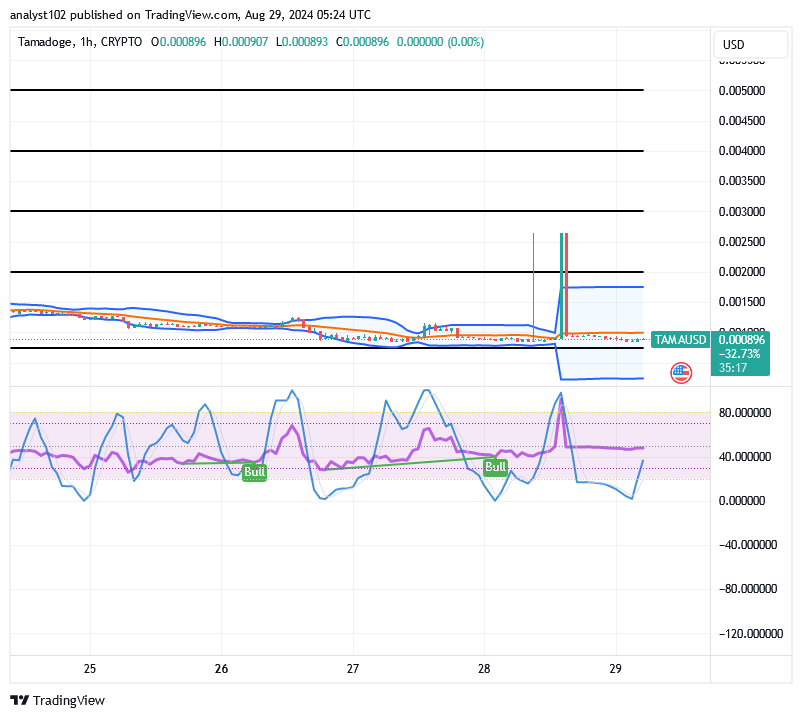
The TAMA/USD short-term chart reveals that the crypto-economic market is presently receding actions, holds rise signs.
The hourly chart’s angle highlights the $0.002 point as the main resistance zone, as the Bollinger Bands indicators have split to reveal their trend lines.The stochastic oscillators have moved out of the oversold areas, indicating that the card is likely to see favorable price changes.
Take action to begin playing any game in the Tamaverse right now in order to receive your fair share of TAMA benefits.
🚨 Attention all #Tamadoge gamers! It’s your last shot to climb this week’s leaderboard! 🚨
— TAMADOGE (@Tamadogecoin) August 7, 2024
Start playing any game now in the Tamaverse and earn your share of $TAMA rewards.
Get in on the action now! 👇 pic.twitter.com/5rctPoReet
Do you want a coin that would 100X in the next few months? That is Tamadoge. Buy TAMA today
Note: Forexschoolonline.com is a financial advisor. Do your research before investing your funds in any financial asset or presented product or event. We are not responsible for your investing results.


Leave a Reply