Tamadoge Price Prediction – April 23
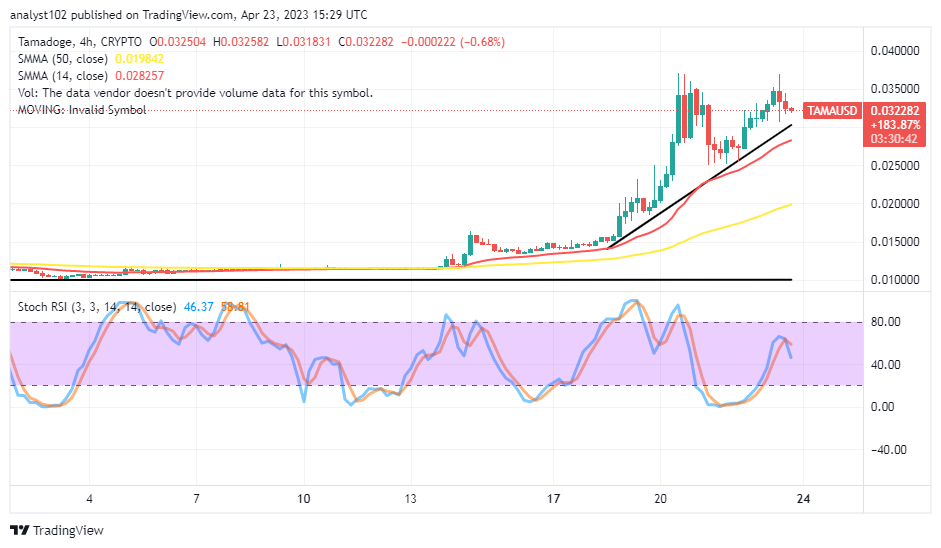
As a notable and reliable emerging uprising crypto, the TAMA/USD market is pending in an upward correction outlook between the trading zones of $0.032582 and $0.031831 value lines. As the prices are at 0.68 percent negative, buyers may purchase again around the lower point of $0.028500. Even if the actions reverse even more forcefully, all of the underlying supports down to the region of $0.02500 are good from a technical standpoint to buy again.
TAMA/USD Market
Key Levels
Resistance levels: $0.03500, $0.04000, $0.04500
Support levels: $0.02500, $0.02000, $0.01500
TAMA/USD – 4-hour Chart
The TAMA/USD daily chart showcases the crypto market is pending in an upward correction outlook, predominantly on the buy signal side of the SMA trend lines. The 14-day SMA indicator is at $0.028257 above the $0.019842 value point of the 50-day SMA indicator. The Stochastic Oscillators have sprung northbound from the oversold region to 58.81 and 46.37, trying to point to the downside. That means a decrease in the valuation of the crypto business is relatively ongoing.
Technically speaking, is it worthwhile to repurchase the TAMA/USD pair at the 14-day SMA trend line?
It would be technically healthy for the TAMA/USD market long-position placers to buy back from around the smaller SMA indicator as the trade is pending in an upward correction outlook. The dropping pace may not go further below the support of $0.02500 in the near time. And that would be to let buying orders prevail.
On the downside of the TAMA/USD technical analysis, sellers’ reactions may not lead to the moment of pressing back the valuation of the crypto to the $0.019842 point of the 50-day SMA in the medium-term run. Traders would need to watch out for a change in the positioning of the Stochastic Oscillators at lower-end trading spots to observe more ideal moments to launch longing orders. Bears are not to follow the market decline motion when volatility occurs.
TAMA/USD 1-hour chart
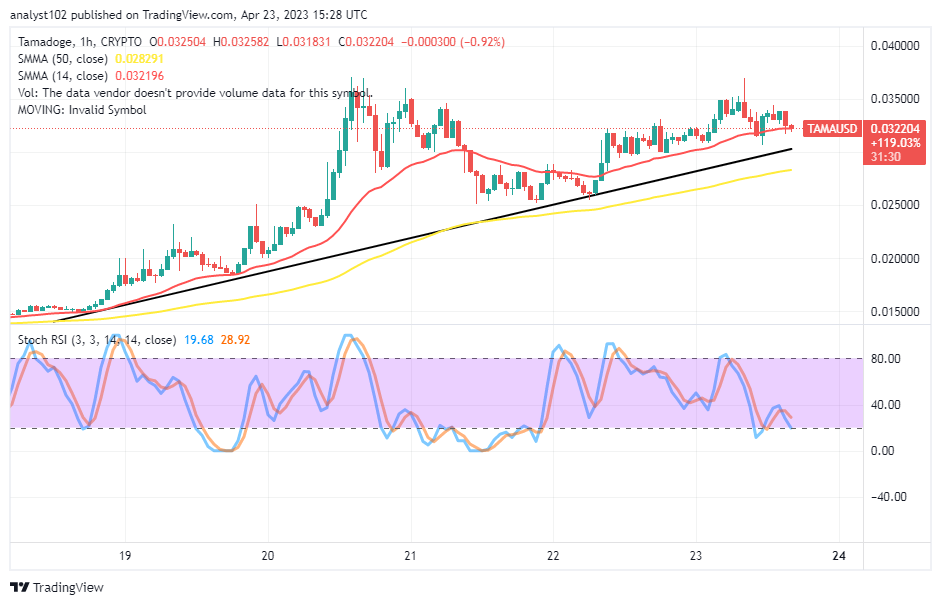
It also revealed on the TAMA/USD 1-hour chart that the market is pending in an upward correction outlook around the trend line of the smaller SMA. The 50-day SMA indicator is at $0.028291, beneath $0.032196. And the bullish trend line drew alongside the path over the bigger SMA trend line to back the gravitational moves to the bullish trend. The Stochastic Oscillators are attempting to cross southbound at 19.68 and 28.92, respectively, at levels 40 and 20. Even in the short term, bears may not push too far and hold their positions too long below support at $0.02800.
Forget about Babydoge, TAMA is winning! In the coming days, it will be listed on top CEXs.
Do you want a coin that would 100X in the next few months? That is Tamadoge. Buy TAMA today
Note: Forexschoolonline.com is not a financial advisor. Do your research before investing your funds in any financial asset or presented product or event. We are not responsible for your investing results.


Leave a Reply