Tamadoge Price Prediction – April 26
Buying moments have dominated the trading activities in the TAMA/USD as the crypto market witnesses a less-active increase in pace. Today’s pushes have been between the trading spots of $0.027521 and $0.028761 lines. Price has been pricing around a positive percentage rate of 3.01. Buyers should continue their buying strategies through the above resistances despite the observed market surging mode.
TAMA/USD Market
Key Levels
Resistance levels: $0.03000, $0.03500, $0.04000
Support levels: $0.01500, $0.01000, $0.00500
TAMA/USD – 4-hour Chart
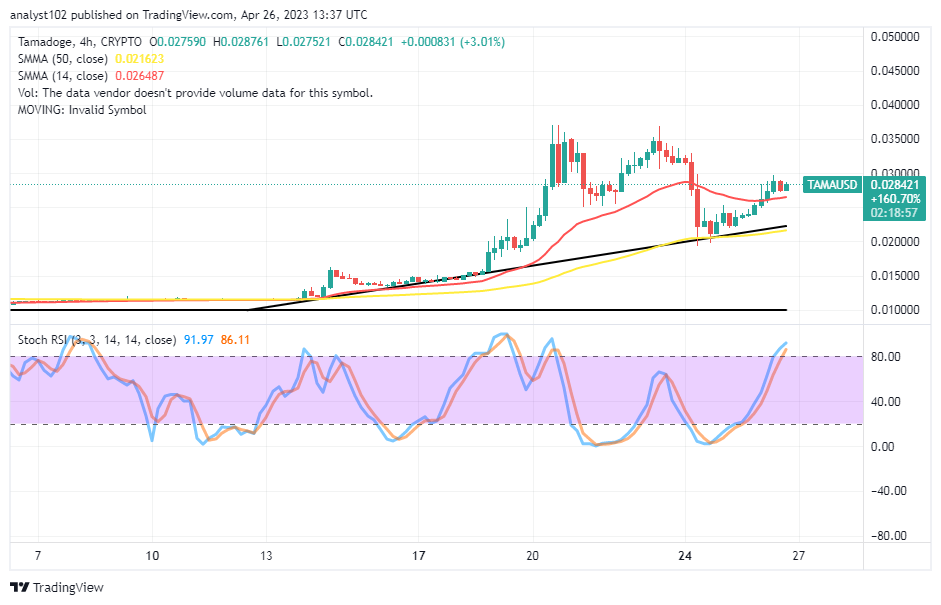
The TAMA/USD 4-hour chart showcases the crypto-economic market experiences an increased bullish pace. The 50-day SMA indicator is at $0.021623, underneath the $0.026487 value line of the 14-day SMA indicator. And they are both pointing toward the northward direction to brighten the trading sentiment of seeing more appreciation levels. The Stochastic Oscillators have managed to swing northbound into the overbought region, keeping 86.11 and 91.97 levels with a space between the two lines.
What’s the probability rate of witnessing a new round of lows going by the current force of the TAMA/USD market?
As there has been a drawing of the bullish trend line backing the 50-day SMA below the current trading point, a sudden free fall-off will probably average $0.02000 if it has to resurface in the TAMA/USD trade as the crypto market experiences an increased bullish pace. To more firmly break through the barrier lines above, market buyers are to concentrate their efforts around the resistance of $0.03000.
On the downside of the TAMA/USD technical analysis, a long-holding of the crypto’s values around the $0.03000 resistance level coupling with a sharp southbound-crossing manner of the Stochastic Oscillators will means that a shift of points to the downside is in the offing. Nonetheless, long-position placers should not entertain any panic that could lead to going for shorting orders.
TAMA/USD 1-hour chart
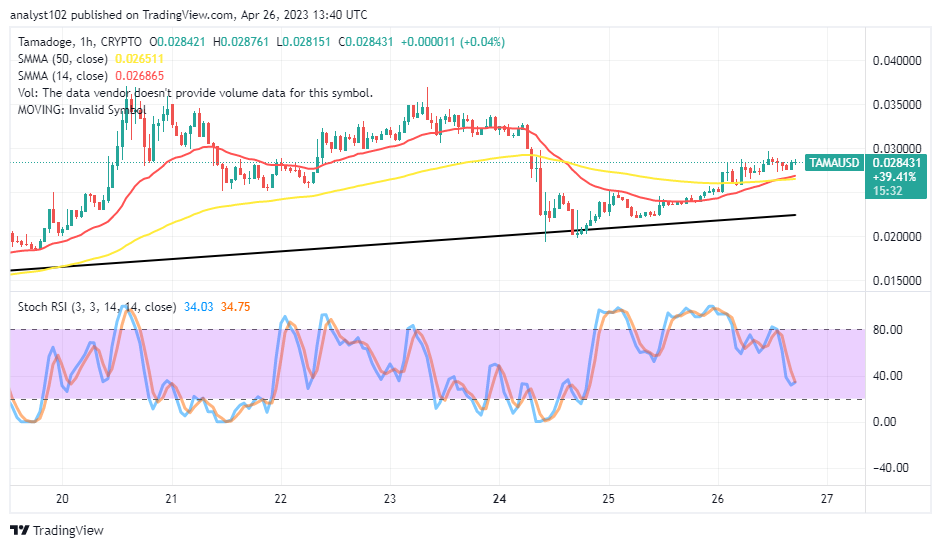
The TAMA/USD 1-hour chart showcases the crypto market experiences an increased bullish pace, pushing through the trend lines of the SMAs. The 14-day SMA indicator has reached a lighter interception of the 50-day SMA indicator around the $0.02600 trading zone. The Stochastic Oscillators have moved southbound briefly past the 40 level. And they are at 34.75 and 34.0 points. It is much more likely to witness rises than reductions, even in the current outlook on a short-term basis.
Forget about Babydoge, TAMA is winning! In the coming days, it will be listed on top CEXs.
https://twitter.com/Tamadogecoin/status/1650862353968422913/photo/1
Do you want a coin that would 100X in the next few months? That is Tamadoge. Buy TAMA today
Note: Forexschoolonline.com is not a financial advisor. Do your research before investing your funds in any financial asset or presented product or event. We are not responsible for your investing results.


Leave a Reply