Tamadoge Price Prediction – September 3
A prolongation of bullish consolidation movement in the business deals involving Tamadoge and the US Dollar as the crypto market is mooning and testing resistances to give birth to erratic reversal situations.
Considering that the market has been underpriced even from its highest value, it will give back more pleasantly surprising positive returns if not sold quickly, just as we have advised long-position placers to leave their buying orders on a long-term running style, following the approach of investors. Values in the range of $0.01000 to $0.009000 are currently needed as the fundamental support levels to confirm the rising trend’s continuation.
TAMA/USD Market
Key Levels
Resistance levels: $0.01200, $0.01250, $0.01300
Support levels: $0.009000, $0.008500, $0.008000
TAMA/USD Medium-term Chart
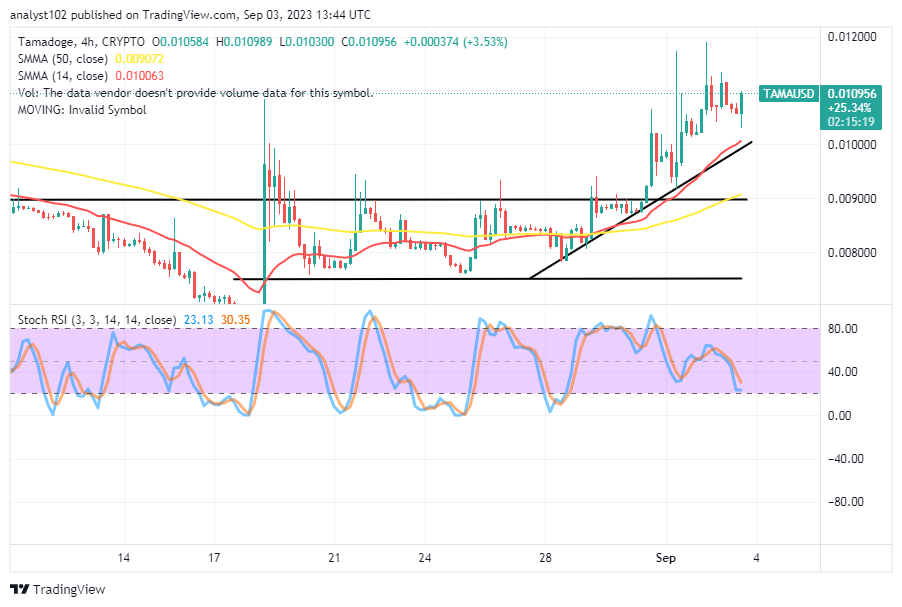
The TAMA/USD medium-term chart shows the crypto economy is mooning above the path of the buy signal side of the moving averages and testing resistances up to the higher point of $0.01200.
The 14-day SMA indicator is $0.010063 above the $0.009072 point of the 50-day SMA indicator. The stochastic oscillators have been awkwardly swerved southbound from the overbought region to feature 30.35 to 23.13 values. And they are conjecturing that it will change back into a northward-pushing mode.
What candlestick formation pattern is now being seen in the TAMA/USD market operations?
The psychological formation pattern of the candlesticks of the TAMA/USD market has been bullish in nature as the TAMA/USD market is mooning and testing resistances above the trend lines of the moving averages.
On the daily chart, an overbought condition has been depicted in order to tame the forces pushing upward. Investors may need to increase the size of their portfolio even if the assumption proves to be accurate in order to continue operating on a long-term basis.
TAMA/USD Short-term chart
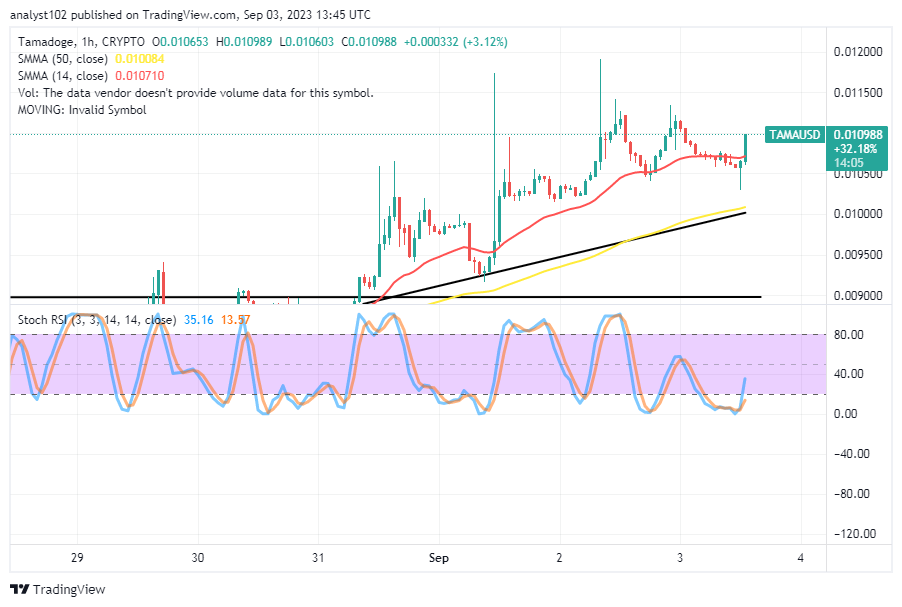
The TAMA/USD short-term chart shows the crypto-economic market is mooning, finding support around the trend line of the 14-day SMA and testing resistances above it at the end.
Above the trend line of the 50-day SMA, buyer reactions have come impressively close to outweighing seller vulnerabilities. Around the point of $0.01000, a bullish trend line has been drawn in the direction of the larger moving average’s supportive mode. The stochastic oscillators first reached a low point in the oversold area before shifting slightly to the north at 13.57 to 35.16, indicating that a purchasing opportunity is still present.
Play our games and earn $TAMA (https://twitter.com/search?q=%24TAMA&src=cashtag_click), then boost it even more by staking. Visit our flexible staking page right away.
Passive income has never been this fun!
— TAMADOGE (@Tamadogecoin) September 3, 2023
Earn $TAMA playing our games, increase it further through staking. Check out our flexible staking today 👉 https://t.co/0rVql9JrJT pic.twitter.com/3bUSBqCBJl
Do you want a coin that would 100X in the next few months? That is Tamadoge. Buy TAMA today
Note:Forexschoolonline.com is not a financial advisor. Do your research before investing your funds in any financial asset or presented product or event. We are not responsible for your investing results.


Leave a Reply