Tamadoge Price Prediction – May 9
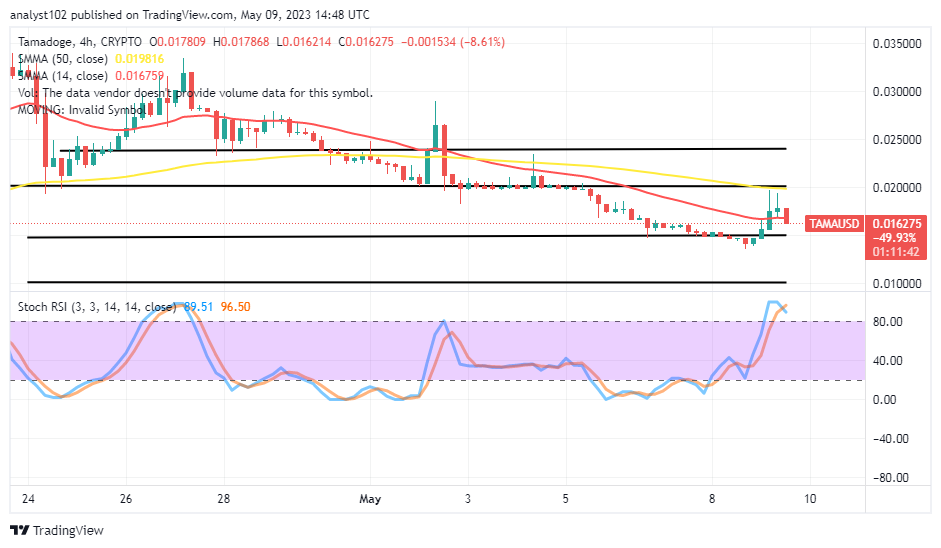
The TAMA/USD market is in a fall cycle before bouncing up after the US Dollar tends to lessen its purchasing weight against the crypto business operations. Price decreases at a negative percentage rate of 8.61, with bearish effects remaining between the peak and low values of $0.017868 and $0.016214. Over a couple of hours into today’s session, indications have surfaced that some lows will still play out below the $0.02000 resistance line for some time.
TAMA/USD Market
Key Levels
Resistance levels: $0.02000, $0.02250, $0.02500
Support levels: $0.01250, $0.01000, $0.00750
TAMA/USD – 4-hour Chart
The TAMA/USD 4-hour chart reveals the crypto market is in a fall cycle before bouncing to regain pushes through overhead barrier-trading levels in the medium-term run. The 50-day SMA indicator is at the $0.02000 line, with the upper range line drawn to mark it as the critical point against the subsequent uprisings. The Stochastic Oscillators are in the overbought region, attempting to cross southbound at 96.50 and 89.51 levels. That implies that some lows should be allowed to make back a correction ahead of regaining upward swings.
Is it acceptable from a technical standpoint to observe reversals in the TAMA/USD market operations against the SMAs at various points in time?
Going by the current repositioning of the Stochastic Oscillators in the TAMA/USD market activities, a retracement process must take up the movement spree as it has been that the crypto market is in a fall cycle before bouncing back to a smooth pathway to the moon side afterward. Long-position takers may wait a while to observe that the Oscillators are back to suggest lower ranges concerning the gravitational values before stepping back for longing orders.
On the downside of the TAMA/USD technical record, sellers expected to have taken advantage of when the market formed double top shadows closely below the 50-day SMA trend line. Failure to have taken a shorting order position around those points could nudge the aftermath selling decision into a risk of being trapped in no time. In addition, sellers are not to aim to push the crypto economy lower toward the support of $0.01000.
TAMA/USD 1-hour chart
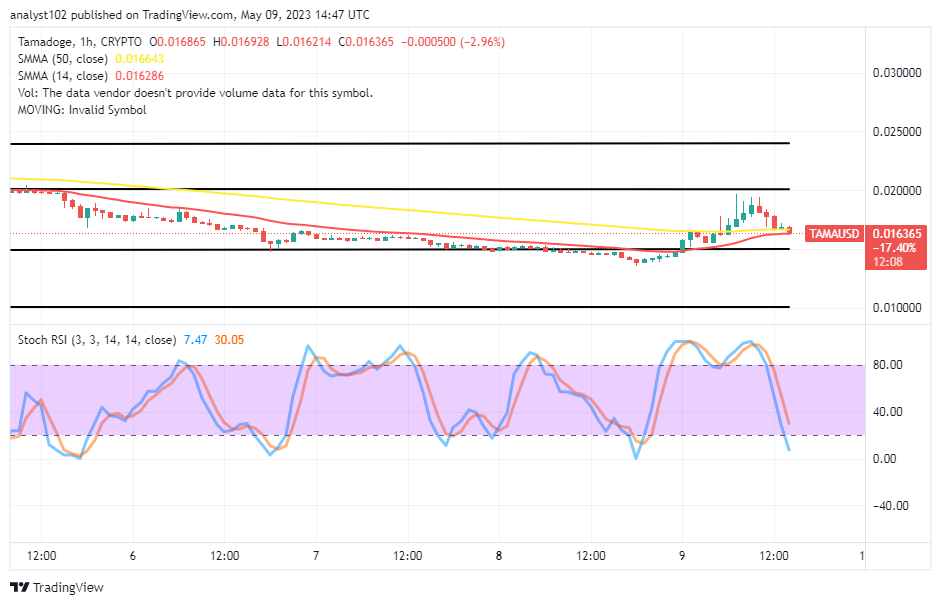
The TAMA/USD 1-hour chart depicts the crypto market in a fall cycle before bouncing back into a continuation of appreciating through some resistances below the psychological upper horizontal line drawn at the $0.02000 support level. The 14-day SMA indicator and the 50-day SMA indicator are closely apart. The Stochastic Oscillators have crossed southbound from the overbought region to 30.05 and 7.47. And yet they continue to indicate that a fall is in view. However, at this time, we do not advocate placing new sell orders.
Forget about Babydoge, TAMA is winning! In the coming days, it will be listed on top CEXs.
https://twitter.com/Tamadogecoin/status/1653374559079342080/photo/1
Do you want a coin that would 100X in the next few months? That is Tamadoge. Buy TAMA today
Note: Forexschoolonline.com is not a financial advisor. Do your research before investing your funds in any financial asset or presented product or event. We are not responsible for your investing results.


Leave a Reply