Tamadoge Price Prediction – August 10
Currently, Tamadoge market activity is in decline, trying to sprout northward from underneath the line of $0.009000.
The psychological trading spot of $0.009000 is evolving into a crucial resistance point as long-position placers anticipate pushing past it in an upward-moving mood. The current pivotal zones are between $0.008500 and $0.008000, where it is possible that the protracted retracement of the movements will pause to allow for another lower of the lowest axis to enter the picture and allow investors to enter the market at a reduced value that is worthwhile of buying.
TAMA/USD Market
Key Levels
Resistance levels: $0.009500, $0.010000, $0.010500
Support levels: $0.008500, $0.007500, $0.006500
TAMA/USD Medium-term Chart
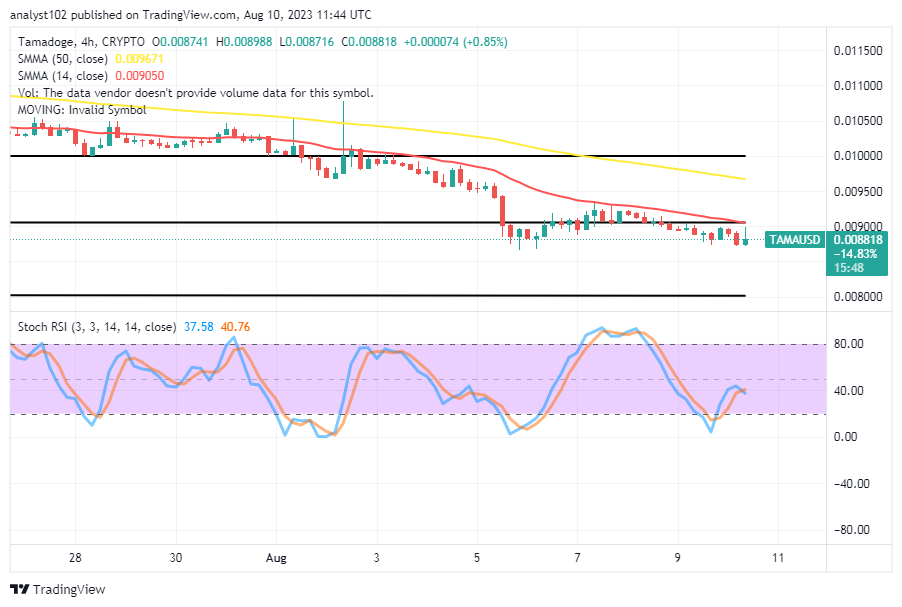
The TAMA/USD medium-term chart showcases that the crypto-economic market is falling and trying to sprout up, even though it is approaching some lows between the values of $0.008500 and $0.008000.
The 14-day SMA indicator is stretching southwardly near the surfacing of variant 4-hour candlesticks as it is positioned at $0.0090500 underneath the $0.009671 value of the 50-day SMA indicator. The Stochastic Oscillators have recently traversed from an oversold region to now attempt to negate it by making an effort to cross back to the south side from 40.76 to 37.58.
Will the market valuation of the TAMA/USD transaction continue to decline at a point or two below the figures mentioned above?
There might still be more emergences of seeing more lows at a flash rate below those underlying support points outlined above in the Tamadoge price against the worth of the US currency, given that the business transaction is falling and trying to sprout up in no time.
Since the important line at $0.01000 was violated to the downside, the counter-trading instrument has been pushing through, aiming for a challenging all-time low due to its relative strength over the shortcomings of the crypto economy. In order to cover the long positions launched thus far in profits and beyond, investors should not refrain from putting in additional money to allow the market to breathe rescuing air into the trade. Long-position takers must continue to buy the dips.
TAMA/USD Short-term chart
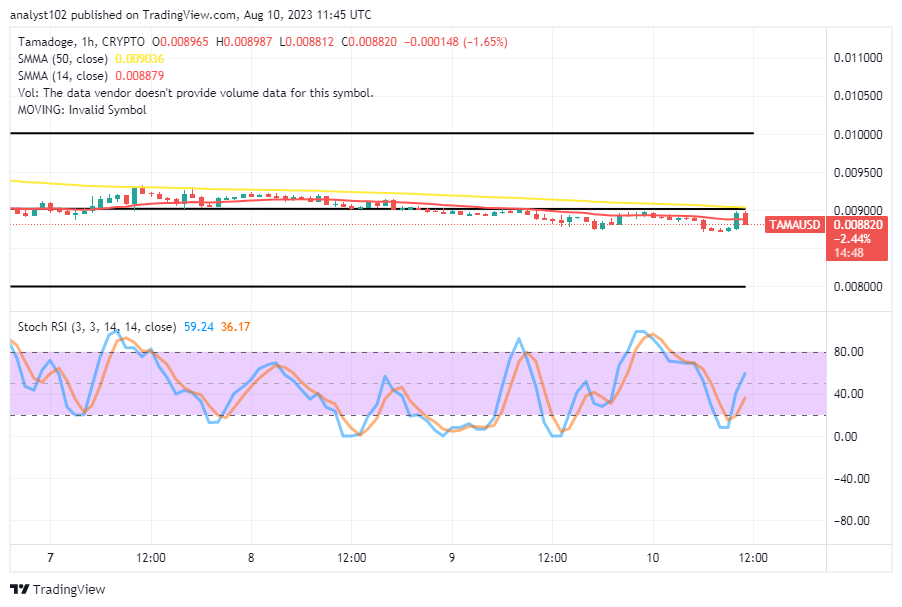
The TAMA/USD short-term chart showcases how the crypto’s price is falling, trying to sprout up most times through the slight southward-bending trend lines of the Moving Averages.
With a narrower gap between them, the 14-day SMA indicator is positioned below the 50-day SMA indicator. The stochastic oscillators have moved past the marks of 36.17 to 59.24 in the upward direction from the oversold area. A bearish candlestick has appeared as of the time of writing this analysis in an effort to counteract the possibility of seeing the price rise further. Therefore, buyers should exercise caution while attempting to join right away. However, if investors frequently increase the size of their portfolios over the long term, the warning may go unnoticed.
iOS users need not fear; Tamadoge Arena will be added to your app library as soon as possible.
“Hi, Steve Jobs’ ghost? Yeah, it’s Tamadoge… We just wanna talk…”
— TAMADOGE (@Tamadogecoin) August 10, 2023
Don’t worry iOS users, we’re working on getting Tamadoge Arena in your app suite asap! pic.twitter.com/WYbxOxRPgx
Do you want a coin that would 100X in the next few months? That is Tamadoge. Buy TAMA today
Note: Forexschoolonline.com is not a financial advisor. Do your research before investing your funds in any financial asset or presented product or event. We are not responsible for your investing results.


Leave a Reply