Tamadoge Price Prediction – August 30
A series of recession price movements has generated over a course of time now leads to declining cycles, putting up spirals in the market operations that involve Tamacoin versus the valuation of the US currency.
Even after consistent, gentle downward movements, the indicators have shown a great deal of promising recouping signs. The likelihood that the price will run in quest of an all-time low value increases with the degree to which the market maintains erratic positions throughout a particular spike. Technically speaking, that is the best way to get dip buys at lower prices.
Key Levels
Resistance levels: $0.002, $0.003, $0.004
Support levels: $0.0005, $0.0003, $0.0001
TAMA/USD Medium-term Chart
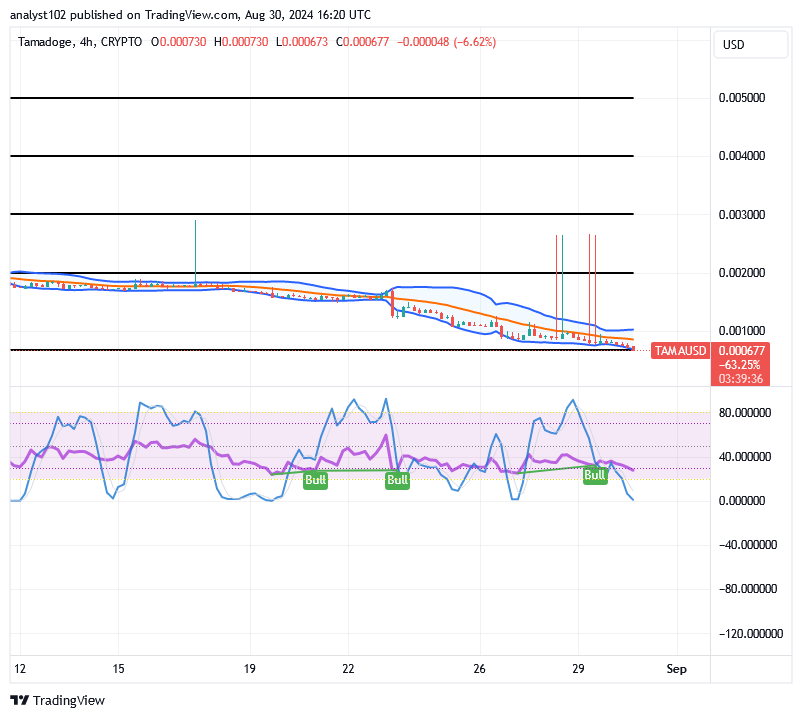
The medium-term TAMA/USD chart shows the crypto-economic market is declining, putting up spiral signals.
The characteristics of the candlesticks are present at variant lower lows, coupled with the lower Bollinger Band trend line. The Bollinger Bands’ trend lines are currently mostly thought to represent the $0.001 mark. A bullish candlestick must persistently emerge against it in order to confirm the possibility of an uptrend resuming. The stochastic oscillators are positioned southerly into the oversold area to indicate that the market is about to descend into a lower area before rising again.
As the TAMA/USD market is slowly pushing southerly around the lower Bollinger Band, is it logical for sellers to play alongside?
Despite the decreasing mode currently in the market operations of TAMA/USD, it is not technically wise for bears to move alongside, given that the crypto market is putting up spiraling indices in the declining proceedings.
Buyers are seemingly looking away systemically in search of decent entries where a longing position order could launch. As that being the situation, staking procedures have to uphold through out the current pushing pace at the bottom side of the indicators. A bounce-off will surface as it has been long envisaged.
The TAMA/USD short-term
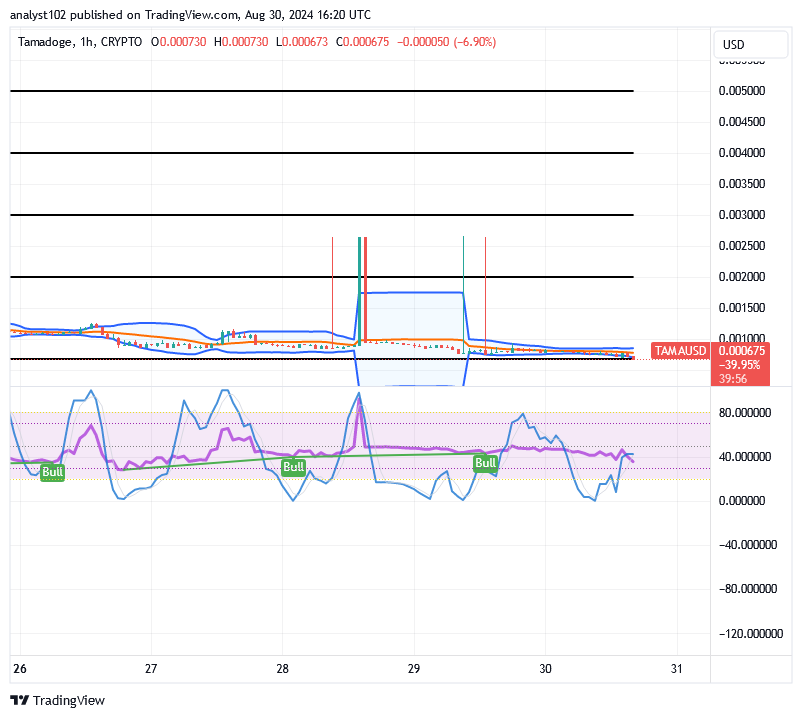
The TAMA/USD short-term chart showcases the crypto-economic market is declining, putting up spiral inputs.
Over the course of a few hours, it has been shown that the Bollinger Bands trend lines have stayed in place and are heading east. Long-term purchasers might expect better times, as indicated by the stochastic oscillators’ swerving pattern.
These days’ youth are unaware of how fortunate they are.


Leave a Reply