Tamadoge Price Prediction – September 26
In a bid to change the transaction positions between Tamadoge versus the US currency for quite a while outside the range-bound points of $0.009000 and $0.008000, the crypto market has now been seen correcting, mustering vigor from the lower-end trading spot.
Allowing the current forces of decline to continue would create a trading environment that would quickly allow holders of long positions to recover using the leverage of rebounding motions. In keeping with that premise, buyers should engage in amazing and clever trading practices without using excessive leverage. On investment platforms, traders are required to increase the size of their portfolios for as long as the plunging movement lasts before returning to a swing-up motion.
TAMA/USD Market
Key Levels
Resistance levels: $0.009000, $0.01000, $0.01100
Support levels: $0.07500, $0.07000, $0.006500
TAMA/USD Medium-term Chart
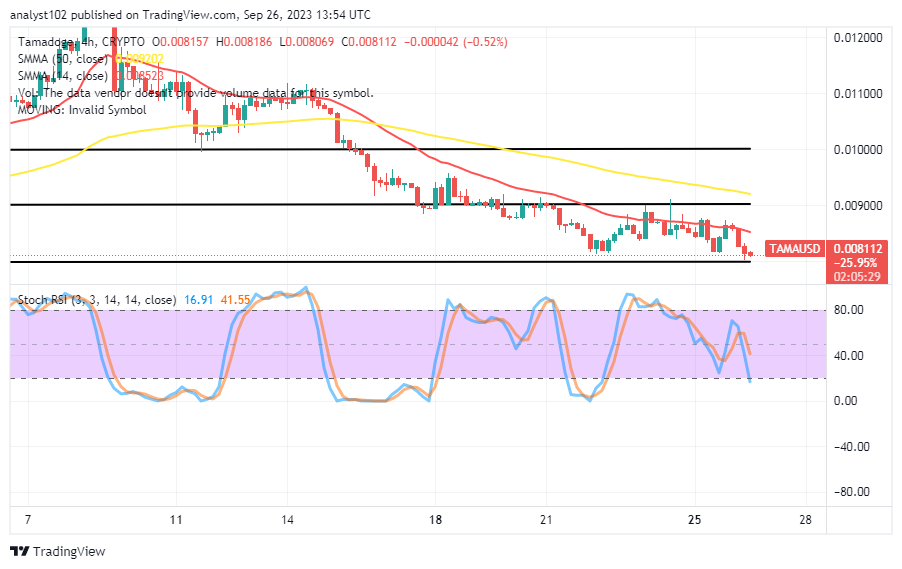
The TAMA/USD medium-term chart showcases that the crypto-economic market is correcting toward the lower range line of $0.008000, mustering vigor to make a rebound.
The 14-day SMA indicator is beneath the 50-day SMA indicator. And they showcase the following points: $0.008523 and $0.009202 as the main barrier-trading points to the current market bargaining spot. The stochastic oscillators are in a southbound-curving mode, ranging from 41.55 to 16.91. That indicates the need for purchasers to fasten their belts toward getting decent entries ahead of sudden shoot-ups.
Should purchasers refrain from buying when the TAMA/USD market is declining?
A declining progression state in a deep lower-trading spot of any given pairing instrument will most of the time regain stances to level up back, especially while talking of emerging economies as the TAMA/USD market is correcting and mustering vigor at this moment.
It is always best for buyers to take positions alongside falling pressures, regardless of the current declining pace that is occurring in the TAMA/USD trade operation, because, without a doubt, the gravitational force to push back in the opposite direction will surely come up in no time. Additionally, joining the motions when they are firmly pushing to the north is not exactly desirable.
TAMA/USD Short-term chart
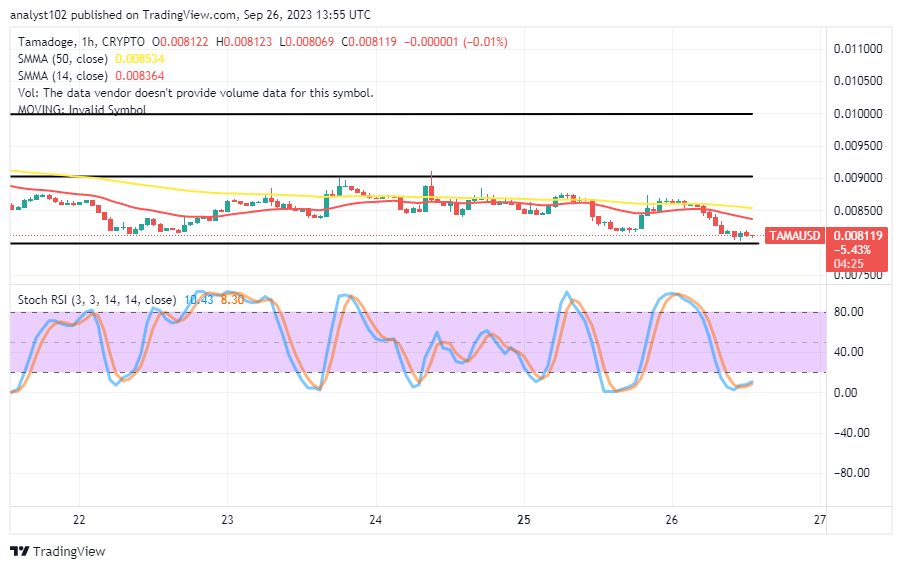
The TAMA/USD short-term chart mirrors the crypto-economic market, which is correcting values toward the lower line of $0.008000, mustering vigor to make a bounce back.
Underneath the 50-day SMA indication is the 14-day SMA indicator. The majority of the gadgets are in states that foretell harsh circumstances for short orders. The stochastic oscillators have entered the oversold region, staying between 8.30 and 10.43, supporting those insights. That suggests that consumers must begin taking positions.
This Thursday, we’re burning $TAMA to commemorate the next step in our roadmap.
To celebrate the next stage of our roadmap we’re burning $TAMA this Thursday 🔥
— TAMADOGE (@Tamadogecoin) September 26, 2023
Stay tuned to our socials for the details 🎉 pic.twitter.com/GZcvSEfjd1
Do you want a coin that would 100X in the next few months? That is Tamadoge. Buy TAMA today
Note:Forexschoolonline.com is not a financial advisor. Do your research before investing your funds in any financial asset or presented product or event. We are not responsible for your investing results.


Leave a Reply