Tamadoge Price Prediction – September 9
Some activities have been enjoyed by the Tamadoge trade bulls before they resort to experiencing a setback against the price worth of the US coin, as the crypto market hits resistance around $0.01500 and the falling motion has been set to let the former instrument gain energy back from an envisaged lower spot.
It should be observed that the path that runs almost parallel to the north direction stays intact above the $0.01000 support line. Buyers would need to practice some patience before leaping back for a while because the downward pressure is too great to just buy against. However, long-term investors, particularly those who are about to or have not yet begun constructing portfolios, can continue to build their portfolios.
TAMA/USD Market
Key Levels
Resistance levels: $0.01200, $0.01250, $0.01300
Support levels: $0.01000, $0.009500, $0.009000
TAMA/USD Medium-term Chart
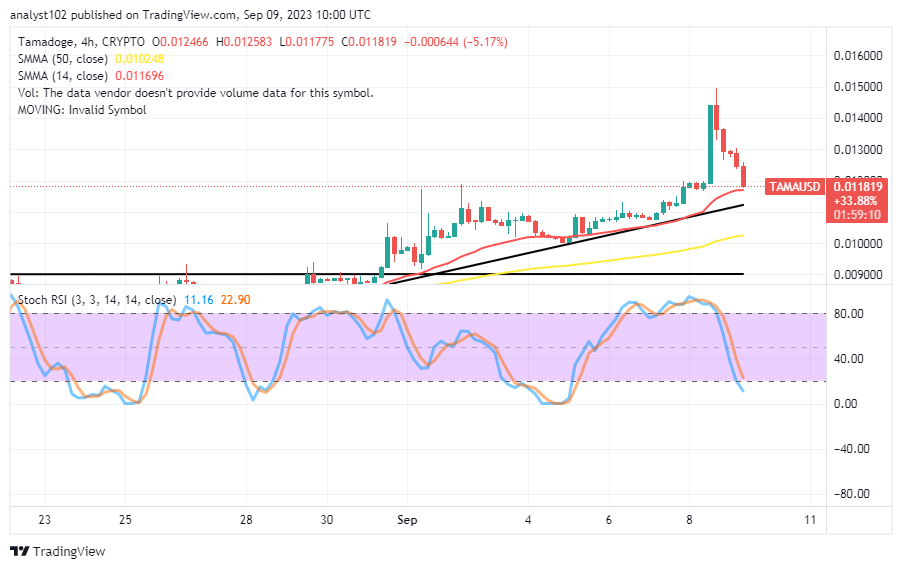
The TAMA/USD medium-term chart showcases that the crypto market hits resistance at $0.01500, as the price is gaining energy above the imaginary support points above $0.01000.
The overall reading postures of the indicators are suggesting that a falling force that is in place is necessarily allowing buyers to get prepared to reshape their pattern to surge higher through higher resistances, given that the 14-day SMA indicator is moving above the 50-day SMA indicator. The stochastic oscillators have curved southwardly to place them between 22.90 and 11.16.
Should TAMA/USD market sellers linger too long with the present declines?
The present declining motion has again entered below notable lower points that could cause a whipsawed session against the TAMA/USD market bears, as even though the price hits resistance around the value of $0.01500, it is expectedly believed that the price will be gaining energy through the use of moving averages.
Long-position takers’ replies should involve tightening their belts in preparation for opening more position orders. Investors can think of the forces working against them as an additional opportunity to build their long-term investment portfolio. 
TAMA/USD Short-term chart
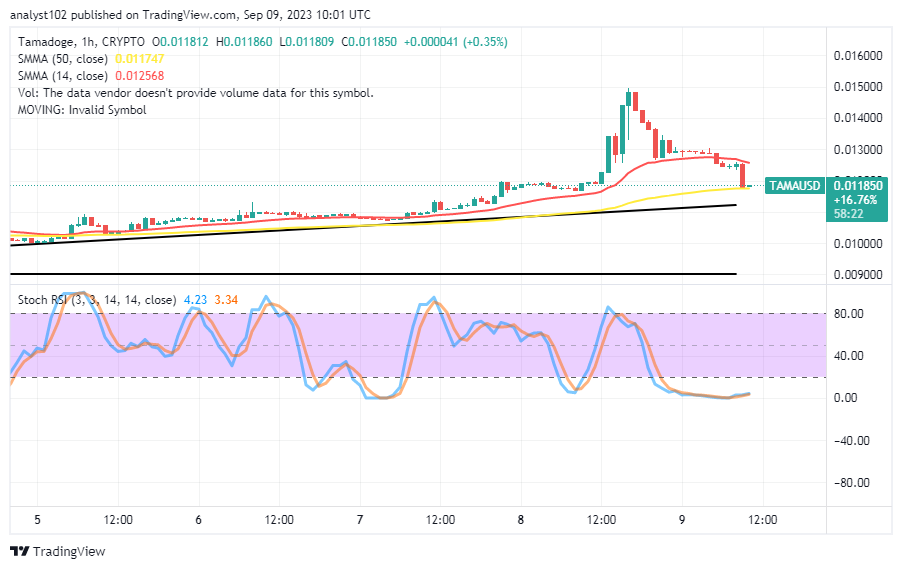
The TAMA/USD short-term chart reveals that the crypto market hits resistance at $0.01500 before reverting to a line of retracements, given that it would be gaining energy from lower-trading psychological points.
The 50-day SMA indicator’s price of $0.011747 is higher than the 14-day SMA indicator’s price of $0.012568. The stochastic oscillators have been consolidating between 3.34 and 4.23, indicating that they are oversold. Without waiting for the formation of any bullish candlestick, long-term buyers may begin purchasing back from the dropping pressure.
When you can play on Arena and make $TAMA (https://twitter.com/search?q=%24TAMA&src=cashtag_click), why play #Starfield (https://twitter.com/hashtag/starfield?src=hashtag_click)? I kid you not; you can do both. Get Tamadoge Arena on your phone.
Why play #starfield when you can play and earn $TAMA on Arena?
— TAMADOGE (@Tamadogecoin) September 8, 2023
Just kidding, you can do both. Download Tamadoge Arena on mobile 👇
📱 Android: https://t.co/INCaGendE4
📱 iOS: https://t.co/Fj9tT5Oicu pic.twitter.com/4cQrOxDbAI
Do you want a coin that would 100X in the next few months? That is Tamadoge. Buy TAMA today
Note:Forexschoolonline.com is not a financial advisor. Do your research before investing your funds in any financial asset or presented product or event. We are not responsible for your investing results.


Leave a Reply