Tamadoge Price Prediction – May 17
We are optimistic about the trade myth that supports that some unprecedented uprisings are in the offing as the TAMA/USD market floats sideways ahead of bounces around the $0.01500 line. A long-concurrent indecision session has played out between the buyer’s and seller’s reactions in this business economy. Several minute percentages have been to affirm the belief of that assumption. In the meantime, traders who cultivate the idea of leaving their positions like investors have a greater chance of reaping the best out of the transaction process after a long time.
TAMA/USD Market
Key Levels
Resistance levels: $0.02000, $0.02250, $0.02500
Support levels: $0.01250, $0.01000, $0.00750
TAMA/USD – 4-hour Chart
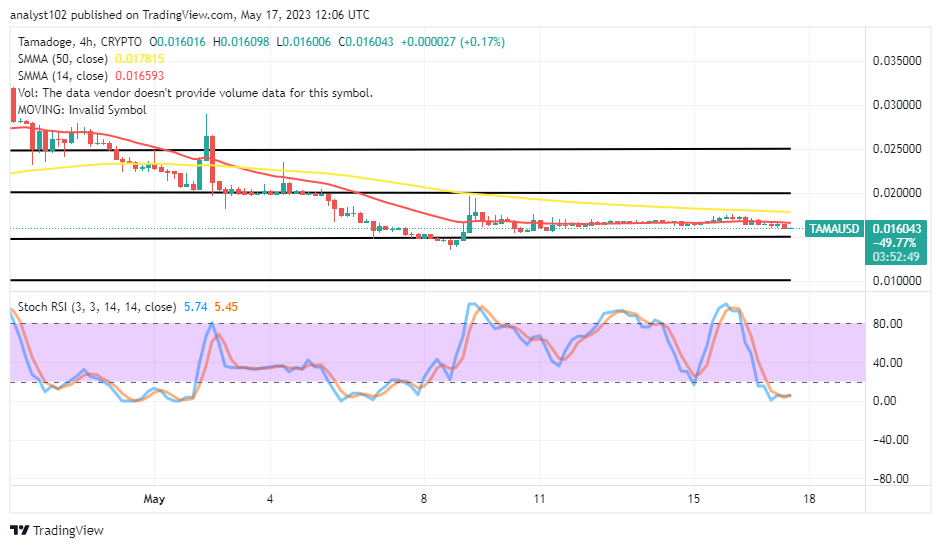
The TAMA/USD 4-hour chart showcases the crypto market is floating sideways ahead of bounces that supposedly have to feature after making a solid baseline of around $0.01500 afterward. The 14-day SMA indicator is at $0.016593 point beneath the $0.017815 value of the 50-day SMA indicator. The Stochastic Oscillators are in the oversold region, maintaining 5.45 and 5.74 levels to signal that a buying effort is in the offing.
Will the selling actions maintain a consolidation cycle around the EMAs of the TAMA/USD market?
It is possible to witness a chain of lower lows around the $0.01500 support zone, especially if the price tends to lessen energy in the TAMA/USD trade as the crypto market is floating sideways ahead of bounces. The positioning of the Stochastic Oscillators in the oversold region has created an ideal to leave some positions running over time. Similarly, long-position takers should hold to their orders.
On the downside of the technical analysis, sellers should be wary of any breakout of the points between the 50-day SMA trend line and the upper-ranging zone at $0.02000. By the capacity rate of the present left0ver decreasing pressure, it would be trick-inclining to expect reliable sell-off situations to dominate the Tamadoge trade headlong.
TAMA/USD 1-hour chart
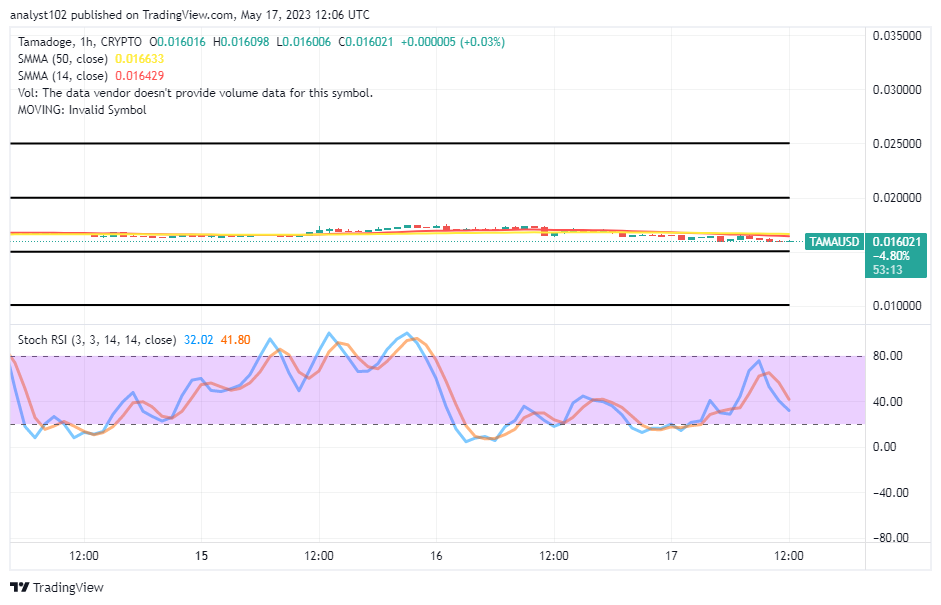
The TAMA/USD 1-hour chart showcases that the crypto-economic market floats sideways ahead of bounces. There has been no tangible change of direction in the price that has been moving in the range trading zones of $0.02000 and $0.01500. The 50-day SMA indicator and the 14-day SMA indicator have remained clogged eastwardly in range-bound spots. The Stochastic Oscillators have crossed southbound from around 80 to 41.80 and 32.02, indicating that some stances are still tentatively in favor of a decline. On the contrary to that situation, it instills that buyers and investors should maintain their positions without nursing any fear.
Forget about Babydoge, TAMA is winning! In the coming days, it will be listed on top CEXs.
Do you want a coin that would 100X in the next few months? That is Tamadoge. Buy TAMA today
Note: Forexschoolonline.com is not a financial advisor. Do your research before investing your funds in any financial asset or presented product or event. We are not responsible for your investing results.


Leave a Reply