Tamadoge Price Prediction – July 24
Despite the fact that bulls in the TAMA/USD trade operations are yet to recoup aggressively as the crypto market fall forces find a bottom, they are striving for hikes from above the $0.01000 support line over time.
With an average minute percentage rate of 0.16 negative, the purchasing weights reflecting different market ups and downs have ranged between $0.010281 and $0.0239. The market’s trade setup continues to be characterized by a recurrent decimation of purchasing actions that have been marked toward the support of $0.0100. Buyers should now retain a harder stance on that value line’s threshold.
TAMA/USD Market
Key Levels
Resistance levels: $0.01200, $0.01400, $0.01600
Support levels: $0.01000, $0.00900, $0.00800
TAMA/USD Medium-term Chart
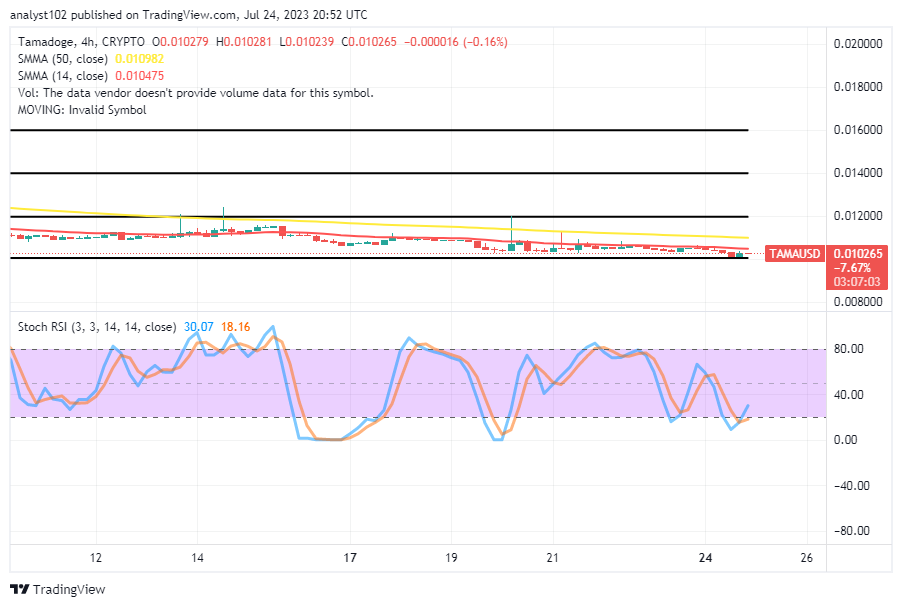
The TAMA/USD 4-hour chart showcases that the crypto-economic market’s fall forces have found a bottom, striving for hikes above the critical support of $0.0100.
It has been long anticipated that long-position takers might have placed a pending buy limit order position around $0.01000, following the failed attempts of the price to sustainably make a northward push to cause a confirmation signal moment of abrupt lows by the indicators. In the meantime, as we write this technical piece, the 14-day SMA is underneath the 50-day SMA. The Stochastic oscillators are attempting to cross northbound from 18.16 to 30.07 points.
Can the stands around or above the $0.0100 barrier in the TAMA/USD market be rebuilt with firmness and strength?
Hope has continued to be on the rise, even though the TAMA/USD market has been unable to surge violently, given that the crypto-economic price fall forces it to find a bottom, striving for hikes.
The buying and holding trade approach has to be continually executed in this crypto business economy, especially as bears have managed to compress the price to this rare lower-trading spot. On the MT4 platform and similar ones, traders should refrain from employing larger lot sizes than their equity can support. Investors must permit their portfolios to run excessively over the long term. Hopefully, bullish moves will obtain more distinct and advantageous entries throughout the coming months and into the upcoming year.
TAMA/USD Short-term chart
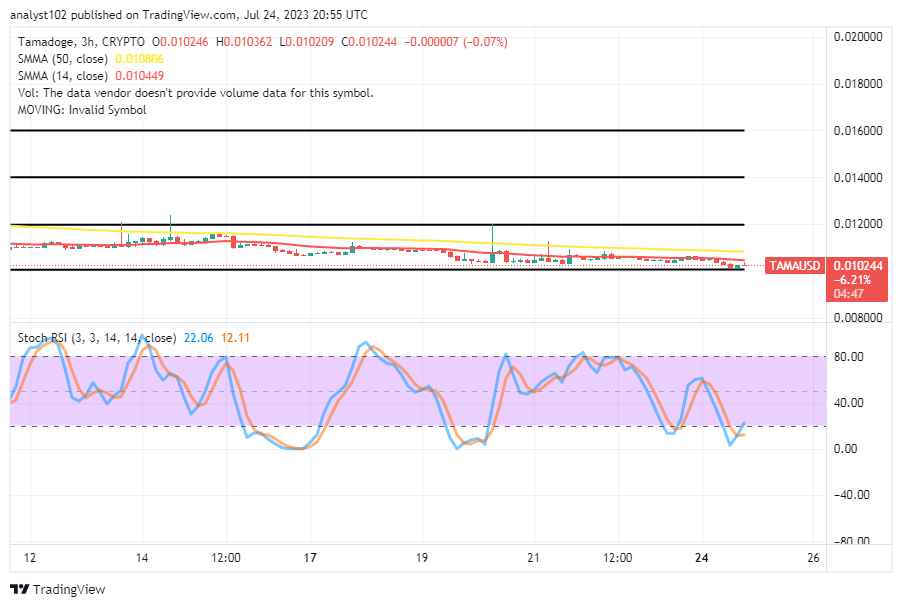
The TAMA/USD short-term chart reveals the crypto-economic market’s fall forces finding a bottom and striving for hikes.
Over the 14-day SMA indicator’s moving course, the 50-day SMA indicator is closely traveling eastward. The Stochastic Oscillators have changed direction and are now moving northward from the oversold area, spanning from 12.11 to 22.06 points. It is rapidly becoming more likely that sellers have arrived at the point where they can now more successfully push through. Therefore, buyers shouldn’t wait any longer to begin launching their routes if that assumption needs to be proven correct.
Interact with our moderators and community managers in real time, and share gaming advice with the rest of the Tama Army.
Want to be even closer to the action? Join our Telegram group to be first in line for news, giveaways and updates! 🤩
— TAMADOGE (@Tamadogecoin) July 24, 2023
Chat directly with our mods and community leads, and trade gaming tips with the rest of the Tama Army 👾💪
📱:https://t.co/yPpSTpMp1p pic.twitter.com/w30umVtNVZ
Do you want a coin that would 100X in the next few months? That is Tamadoge. Buy TAMA today
Note: Forexschoolonline.com is not a financial advisor. Do your research before investing your funds in any financial asset or presented product or event. We are not responsible for your investing results.


Leave a Reply