Tamadoge Price Prediction – September 20
The positioning of the trend in the market operations between Tamadoge and the American coin has been bearish, connoting presently that the crypto market eyes are hiking from around the line of $0.009000, following a stand that the price finds eventually closely beneath the point.
Accordingly, traders using the MT4 platform and others are urged to refrain from overleveraging their positions, especially if they are taking their positions with a small amount of equity. However, given that it is still operating at reduced pricing if it is on other investing platforms, they are urged to keep adding more to their portfolios.
TAMA/USD Market
Key Levels
Resistance levels: $0.01000, $0.01100, $0.01200
Support levels: $0.008500, $0.07500, $0.06500
TAMA/USD Medium-term Chart
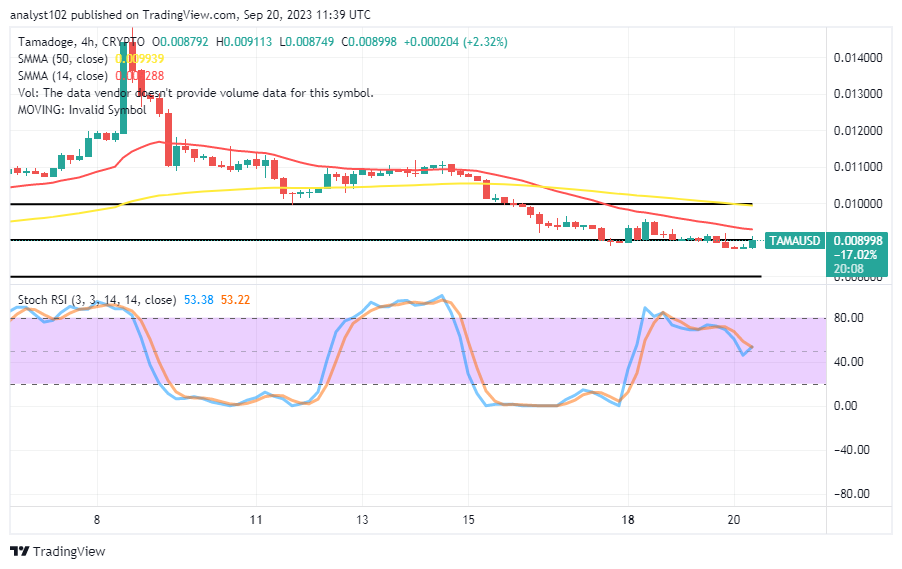
The TAMA/USD medium-term chart showcases that the crypto-economic market is hiking away from the arena of $0.009000, following a stand.
The 14-day SMA indicator has been placed underneath the 50-day SMA indicator, ascertaining the logical points that the price will have to breakthrough from $0.009288 to $0.0099939. The stochastic oscillators are slantingly stretched southbound from the overbought region to prepare for a cross from 53.22 to 53.38, indicating a promissory rising signal.
What is the current reading outlook for the TAMA/USD market’s current 4-hour candlestick?
A bullish trading candlestick has surfaced in the market operations between Tamadoge and the US currency to confirm that a buying spree is on the rise, given that the cryptocurrency market eyes are hiking from the underneath of the trend lines of the moving averages.
Given that a depression path has not yet been broken northward through the SMAs, long-position placers should keep improving their positions. Before the $0.01000, a sharp rebound is anticipated to create breakthrough resistances. We believe that sellers would be taking a risk by placing orders near the larger SMA’s pivot point. As a result, careful compliance with the opening of longing orders is required.
TAMA/USD Short-term chart
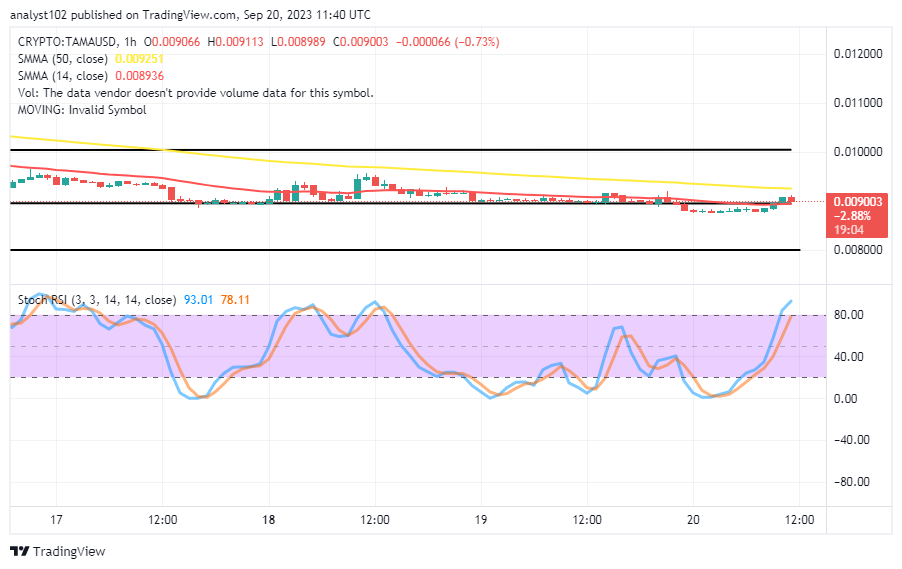
The TAMA/USD short-term chart showcases the crypto market eyes hiking through some resistances, following a stand from a close underneath of the $0.009000.
The 14-day SMA indicator is located at $0.008936, which is under the 50-day SMA indicator’s $0.009251. The stochastic oscillators have partially positioned themselves in the overbought region after moving northward from the oversold region. Additionally, they are moving from 78.11 to 93.1. Technically speaking, existing traders may want to wait for a little change back to the downside and use the oscillators as a guide to choose when to enter.
NFTs from our new dynamic NFT collection are available in common, rare, and ultra-rare varieties.
NFTs = More $TAMA 🎉
— TAMADOGE (@Tamadogecoin) September 20, 2023
Common, Rare and Ultra Rare NFTs are available from our new dynamic NFT collection 👉 https://t.co/h6ol6RHHHh pic.twitter.com/4CVsOMqm6E
Do you want a coin that would 100X in the next few months? That is Tamadoge. Buy TAMA today
Note:Forexschoolonline.com is not a financial advisor. Do your research before investing your funds in any financial asset or presented product or event. We are not responsible for your investing results.


Leave a Reply