Tamadoge Price Prediction, January 4
In the last few hours, an active gravitational force has surfaced to shake off the path that has been noticed as a prolongation sideways to the downside, as the TAMA/USD trade has dropped past the flash line of $0.00800, finding a support line toward the point of $0.00700.
The current state of the transaction has been interpreted as a repositioning pattern, indicating that a chance to secure dip-buy procedures exists. Never sell a longing position out of fear if it is executed at a higher price than $0.00900. Rather, investors ought to initiate the process of purchasing alongside additional falls in the event that the scenario persists.
TAMA/USD Market
Key Levels
Resistance levels: $0.0090, $0.0100, $0.0110
Support levels:$0.0075, $0.00700, $0.0065
TAMA/USD Medium-term Chart
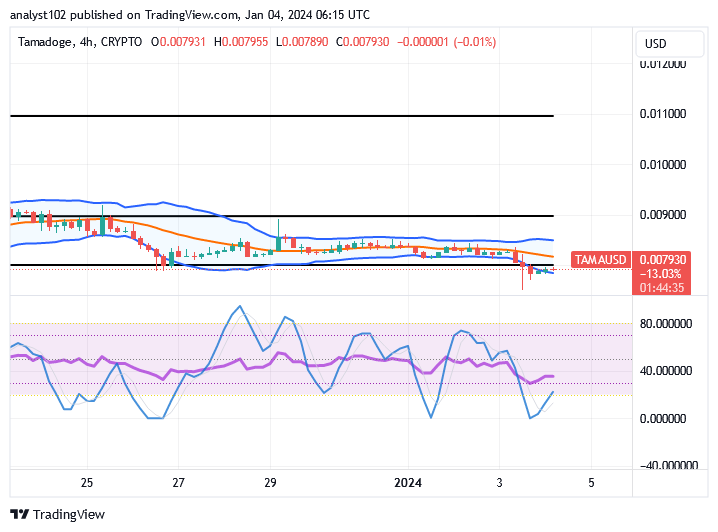
The TAMA/USD medium-term chart reveals that the crypto-economic trade has dropped through the initial vital support line of $0.008, finding a support line.
The Bollinger Band trend lines have been slightly forced downward. A bearish candlestick has a bottom shadow against the lower end of the indicators. The stochastic oscillators have penetrated the oversold region, signifying that time is getting riper as it is tending to fall more.
Should bearish investors continue to believe that the TAMA/USD market will decline more as it hovers around $0.007930?
For short-position pushers to retain the habit of going further southerly from the point of $0.007930 would amount to a great mistake because the situation has been garnering energy as the TAMA/USD trade has dropped through $0.00800, finding a support line.
The recent bearish candlestick with a bottom shadow, when viewed technically, has created a favorable scenario that bulls can take advantage of. For those coming out of college looking to invest in the market and land big jobs, this is a fantastic opportunity. Sellers are advised not to open any new trade orders as the price has been trading near the lower Bollinger Band trend line.
TAMA/USD short-term chart
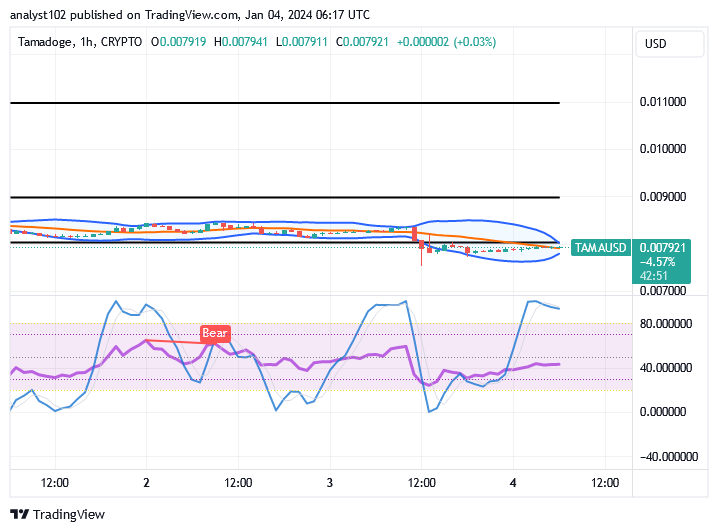
The TAMA/USD short-term chart showcases that the crypto trade has dropped through the value of $0.00800, finding a support line above $0.007.
The Bollinger Band indicators have been placed systemically to the south, embodying some lower points beneath the line of $0.00800. The stochastic oscillators are overbought, indicating that fear should not be expected on an hourly basis unless buyers are forced to consolidate. Apart from that, investors ought to proceed with obtaining a sufficient number of points prior to the resurgence of a positive trend.
Tonight is the last week of the 2024 competitions!
Share your score on any Tamadoge game right now to get your portion of
The first weekly competitions of 2024 end tonight!
— TAMADOGE (@Tamadogecoin) January 3, 2024
Post a score on any Tamadoge game today and earn your share of $TAMA 👇
📱 Android: https://t.co/D4TjX7gTFl
📱 iOS: https://t.co/0fjJapf5oA pic.twitter.com/HqsHv57gx4
Do you want a coin that would 100X in the next few months? That is Tamadoge. Buy TAMA today
Note:Forexschoolonline.com is not a financial advisor. Do your research before investing your funds in any financial asset or presented product or event. We are not responsible for your investing results.


Leave a Reply