Tamadoge Price Prediction – July 20
There seems to be a prolongation of slight momentum-losing cycles in the TAMA/USD trade business exchanges, leading to the condition that the crypto-economic market decompresses, struggling to gain a foothold.
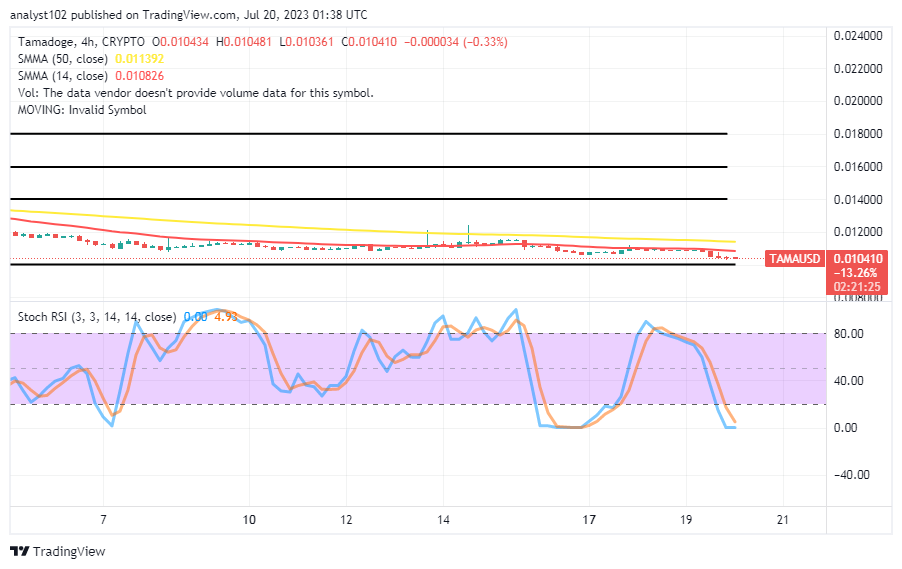
The market’s trade percentage is resting at a minute negative of 0.33 at the time this technical article is put together, negotiating between $0.010481 and $0.010361. The dominant transaction vibes nevertheless indicate that there are still opportunities to buy from window dips in the cryptocurrency’s value relative to the US dollar before favorable presumptions of northward pushes occur shortly later.
TAMA/USD Market
Key Levels
Resistance levels: $0.01200, $0.01400, $0.01600
Support levels: $0.01000, $0.00900, $0.00800
TAMA/USD – 4-hour Chart
The TAMA/USD 4-hour chart mirrors the crypto market, which is decompressing to gain a foothold possibly around or toward the support level of $0.01000 in the long or medium term run.
At $0.010826 of the market value, the 14-day SMA indicator is staying underneath the $0.011392 point of the 50-day SMA indicator. The Stochastic Oscillators have maintained lows between 4.93 and 0.00 while stretching back southward from the overbought region into the oversold region. This demonstrates that the downward force is approaching depletion.
What is the distinctive level of devaluations set to the southward side at this time in TAMA/USD trade activities?
A quick technical peep into the analysis through a long-term angle that is not too far away still suggests that some levels of lows might still play out between the $0.01200 and $0.01000 points of the TAMA/USD market, as it has been asserted that the crypto-economic price decompresses at the moment to gain a foothold soon.
Falling trading features have been generally placed under a risky entry setup in this market’s activities. Therefore, placing an immediate sell order alongside any active motion that can result in a disadvantage would be an unethical technical trading strategy. Instead, before taking gains after a while, traders should maintain buying and hold onto their positions to run at any points of entry. 
TAMA/USD 1-hour chart
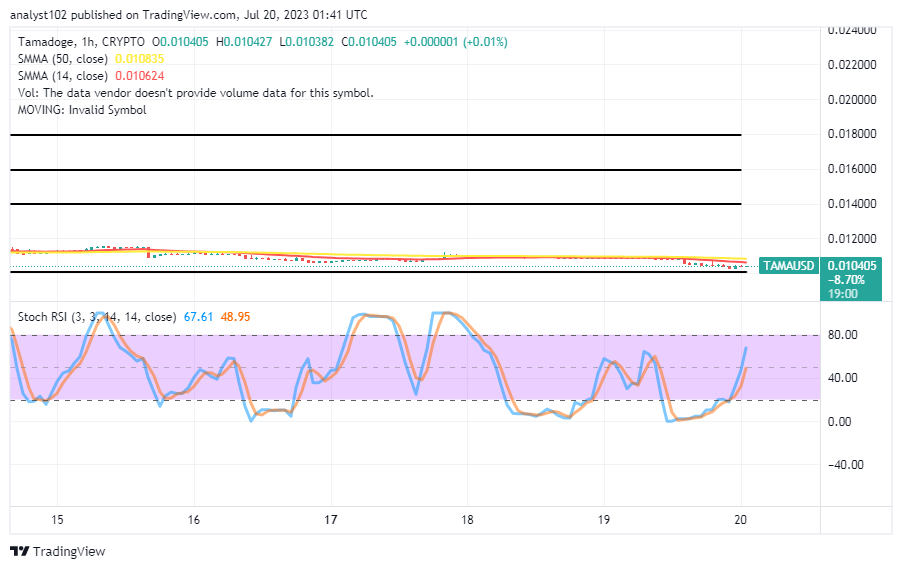
The TAMA/USD 1-hour chart reveals the crypto market decompresses purposefully to gain a foothold from a point that is nearer to the support line of $0.01000.
The 14-day SMA indicator is positioned at $0.010624 below the $0.010835 point of the 50-day SMA indicator. The stochastic oscillators have moved out of the oversold area and are now moving northward from 48.95 to 67.61 in an effort to move further north. It suggests that the cryptocurrency economy is moving closer to establishing a solid foundation that will quickly produce swing highs.
This IS NOT A DRILL. Get involved by 11:59 p.m. tonight since the prize pools will reset at midnight!
🚨THIS IS NOT A DRILL!🚨
— TAMADOGE (@Tamadogecoin) July 19, 2023
We repeat, NOT A DRILL 🚩🚩🚩
The prize pools will reset at midnight tonight, so get in on the action before 11:59pm tonight! pic.twitter.com/Xx3bVoqwPd
Do you want a coin that would 100X in the next few months? That is Tamadoge. Buy TAMA today
Note: Forexschoolonline.com is not a financial advisor. Do your research before investing your funds in any financial asset or presented product or event. We are not responsible for your investing results.


Leave a Reply