Tamadoge Price Prediction – May 25
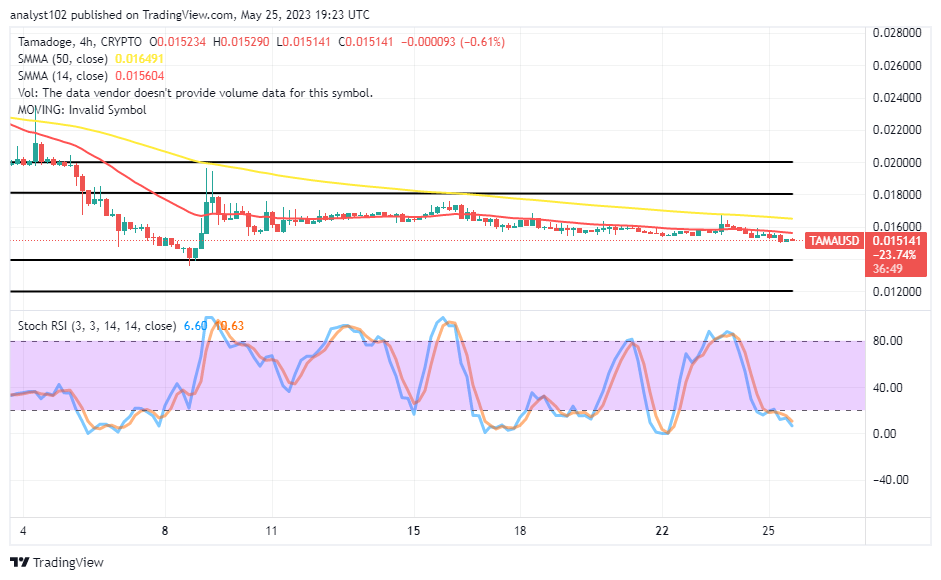
Several indications have been cropping in the TAMA/ USD trade transactions over time to suggest the crypto-economic market could soon rebound following the inability of the counter-trading instrument to outweigh the trading arena forcibly southward below the $0.01500 psychological line. As of this technical piece, a minute negative percentage rate of 0.61 is in the card to show that price is trading between $0.015290 and $0.015141 points. Bears could stop attempting to play additional orders around the present trading value to prevent unnecessary whipsawed moments,
TAMA/USD Market
Key Levels
Resistance levels: $0.01800, $0.01900, $0.02000
Support levels: $0.01400, $0.01300, $0.01200
TAMA/USD – 4-hour Chart
The TAMA/USD 4-hour chart reveals the crypto-economic market could soon rebound in line with what the Oscillators tool displays presently. Variant smaller bearish candlesticks have been sequentially forming to the point of reasonable exhaustion downwards. The 14-day SMA indicator is at $0.015604 beneath the $0.016491 value line of the 50-day SMA indicator. The Stochastic Oscillators have crossed southbound from around 80 to 10.63 and 6.60, pointing to the downside to indicate that a reduction is tentatively ongoing.
What candlestick shape or emergence could likely end the current TAMA/USD market trading session near the 14-day SMA?
A kind of full-body bullish candlestick has to resort to taking up a long path against the trend lines of the SMAs to nullify the effects of bears so far in the TAMA/USD trade operations, believing that the crypto-economic market could soon rebound from around the $0.01500 support or a little lower afterward. The sellers’ capacity trading force forecast has remained inactively composed, making it difficult to get a decent shorting order. In our view, buyers should keep holding onto their long holdings.
TAMA/USD 1-hour chart
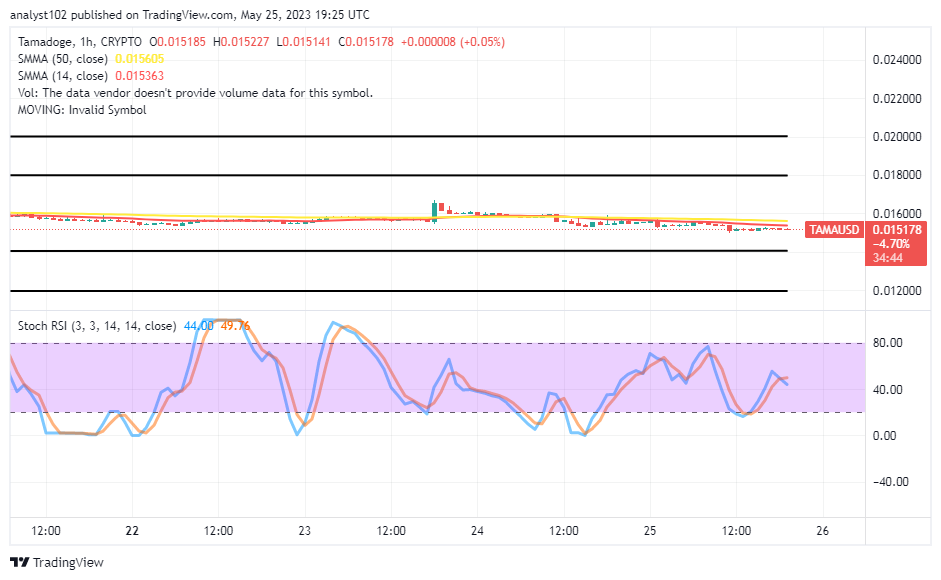
The TAMA/USD 1-hour chart reveals the crypto-economic market could soon rebound from around the conjoined trending area of the SMA trend lines. There has been a light disconnect between the indicators as the 14-day SMA shifted the base slightly to the downside. The Stochastic Oscillators are around 49.76 and 44.00 to signify that the pushing myth of the base crypto is still somewhat on the verge of losing a stance for a while. Such a situation will produce a better deal for buyers in the long run.
Forget about Babydoge, TAMA is winning! In the coming days, it will be listed on top CEXs.
https://twitter.com/Tamadogecoin/status/1653374559079342080/photo/1
Do you want a coin that would 100X in the next few months? That is Tamadoge. Buy TAMA today
Note: Forexschoolonline.com is not a financial advisor. Do your research before investing your funds in any financial asset or presented product or event. We are not responsible for your investing results.


Leave a Reply