Tamadoge Price Prediction – June 5
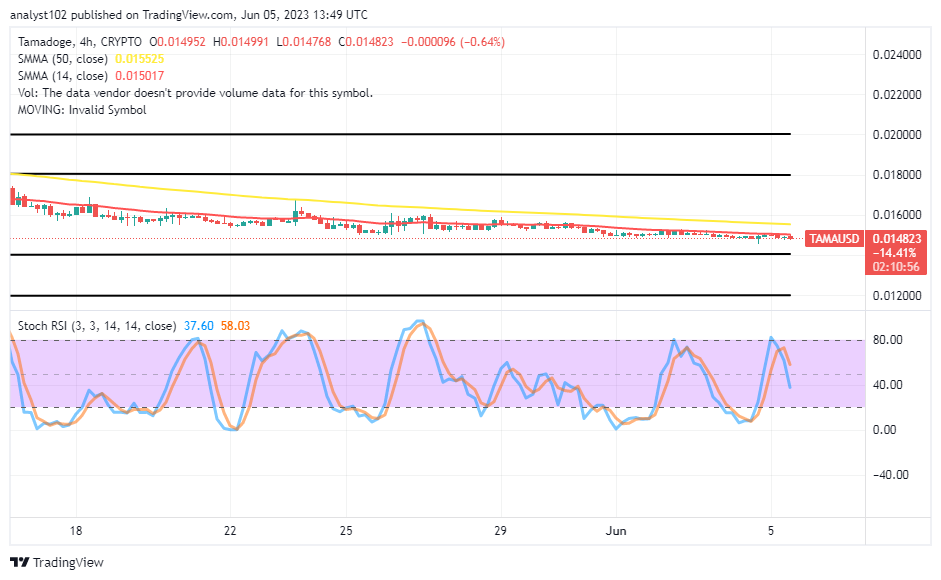
There have notable lighter decreases in the TAMA/USD trade as the crypto market makes a way around it to continue, making strong buys from its dipping moves. The value lines of $0.014991 and $0.014768 have constituted the trading spots at an average negative percentage rate of 0.64. Ideally, the trade support line will serve as a crucial against subsequent low features around $0.01400, which is if a worst-case scenario has to play out southward in a manner afterward.
TAMA/USD Market
Key Levels
Resistance levels: $0.01750, $0.01850, $0.01950
Support levels: $0.01400, $0.01300, $0.01200
TAMA/USD – 4-hour Chart
The TAMA/USD 4-hour chart showcases the crypto-economic market continues with strong buys from dipping sessions that have been forthcoming on a lighter-moving mode around the smaller trend line. At the moment of this technical piece, the 14-day SMA indicator is at $0.015017, underneath the $0.015525 value line of the 50-day SMA indicator. The Stochastic Oscillators have crossed from 80 to 58.03 to 37.60 points in the southward, indicating that there is perhaps still motion in the opposite direction of the north.
When will it be optimum to quit relying on the Oscillators’ readings to choose when to purchase into the TAMA/USD market?
The reading of the Stochastic Oscillators to determine to buy entry order cannot be quantified at any other point in time, especially if there has been no trading candlestick formation to oppose the direction they are pointing at a given moment. In the meantime, the TAMA/USD market continues with strong buys from dipping sessions that have surfaced, probably causing fearful thoughts of losing out buying orders at some other times. A quick response to that assumption is that the market is rebuilding the basis for thresholds to thrive in its aftermath rebounding motions. And that will take its form skyrocketing without formal notice or announcement.
TAMA/USD 1-hour chart
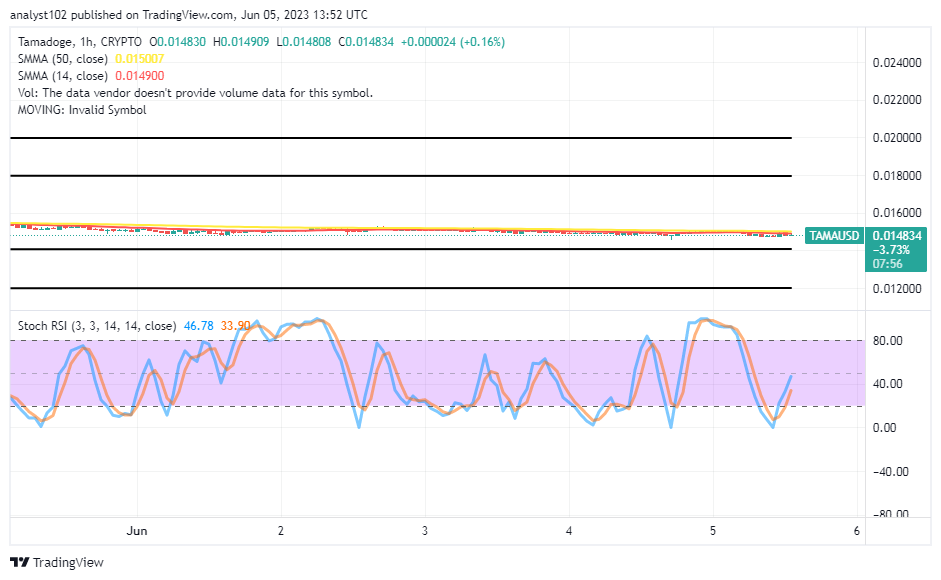
The 1-hour chart showcases the crypto-economic market continues with strong buys from lighter variant dips around the conjoined trend lines of the SMAs. The 14-day SMA indicator is at $0.014900, beneath the $0.015007 value line of the 50-day SMA indicator. The Stochastic Oscillators have swerved northbound from the oversold region to 33.90 to 46.78 levels. Observation still denotes that the support line at $0.01400 will remain the benchmark that bears may push toward making a total end of their journey to produce a free flow of rises in the long run. However, investors who have bought into this emerging market should not sell in a hurry, no matter how long it will be.
We are unsure why you are still reading this tweet if you could not be playing in the Tamadoge Arcade right now with a simple sign-up process in Web3 gaming and 20 free credits for new users.
With the easiest sign up in Web3 gaming, plus 20 free credits for new players, we’re not sure why you’re still reading this tweet and not playing in the Tamadoge Arcade right now…? 🐶🦴
— TAMADOGE (@Tamadogecoin) June 5, 2023
Sign up and get playing now 👉 https://t.co/IWYl78XAUy pic.twitter.com/AiGqccy5PH
Do you want a coin that would 100X in the next few months? That is Tamadoge. Buy TAMA today
Note: Forexschoolonline.com is not a financial advisor. Do your research before investing your funds in any financial asset or presented product or event. We are not responsible for your investing results.


Leave a Reply