Tamadoge Price Prediction – August 8
Over the past couple of days, a line of sideways has cropped up in the TAMA/USD trade operations as the crypto-economic market condenses around the trade zone of $0.00900 and tends to blowup at a later time that appears not to keep longer than necessary.
It is strongly advised that long positions be placed between the results of the medium- and short-term running modes. The better circumstance of those previously anticipated moments, nevertheless, is when a daily chart predicts a northward move following a satisfying trading session.
TAMA/USD Market
Key Levels
Resistance levels: $0.01000, $0.01100, $0.01200
Support levels: $0.00850, $0.00750, $0.00650
TAMA/USD Medium-term Chart
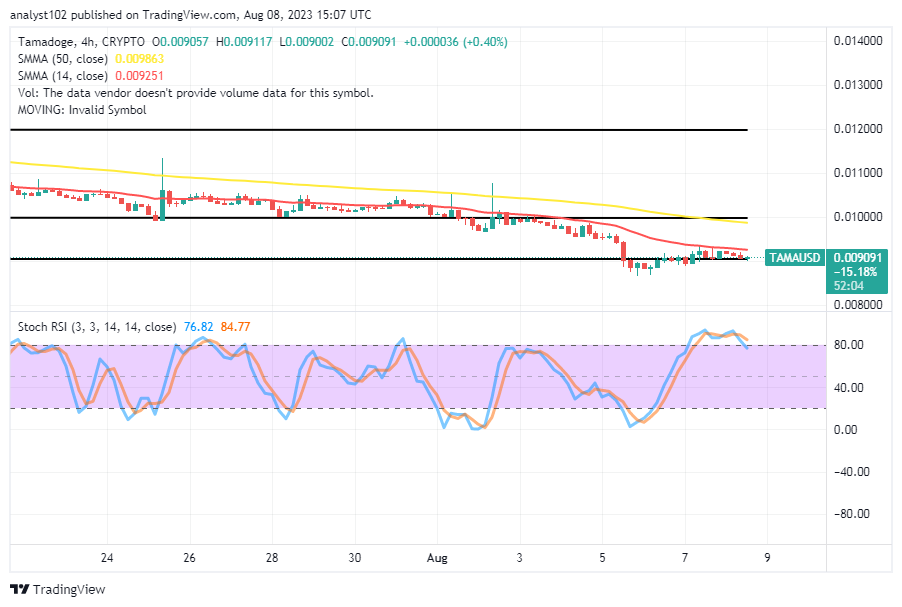
The TAMA/USD medium-term chart showcases that the crypto-economic market condenses firmly around $0.00900 and tends to blow up in valuation against the purchasing power of the US coin.
The 50-day SMA indicator’s value is $0.009863, while the 14-day SMA indicator is at $0.009251. Candlesticks showing the ups and downs have not yet produced another clear direction away from $0.00900 at this time. The stochastic oscillators are making a little inroad into the overbought area as they attempt to reverse direction from 84.77 to 76.82.
When will the plunging transaction cycle on the TAMA/USD market end?
As there has been a relatively continual drawback in the Tamadoge market valuation versus the US currency, it might still take a while systemically before an ideal shift in the opposite direction comes to play out, given that the crypto market condenses at the trade zone of $0.00900 and tends to blowups.
When there are more bulls present on the market, there is a chance that a spiraling motion may develop, perhaps increasing the volume of bitcoin trades. A clear push path back into gaining stable ups moving ahead in the long-term run mode will be produced by a cross section of the 50-day SMA trend line by the 14-day SMA trend line to the upside.
TAMA/USD Short-term chart
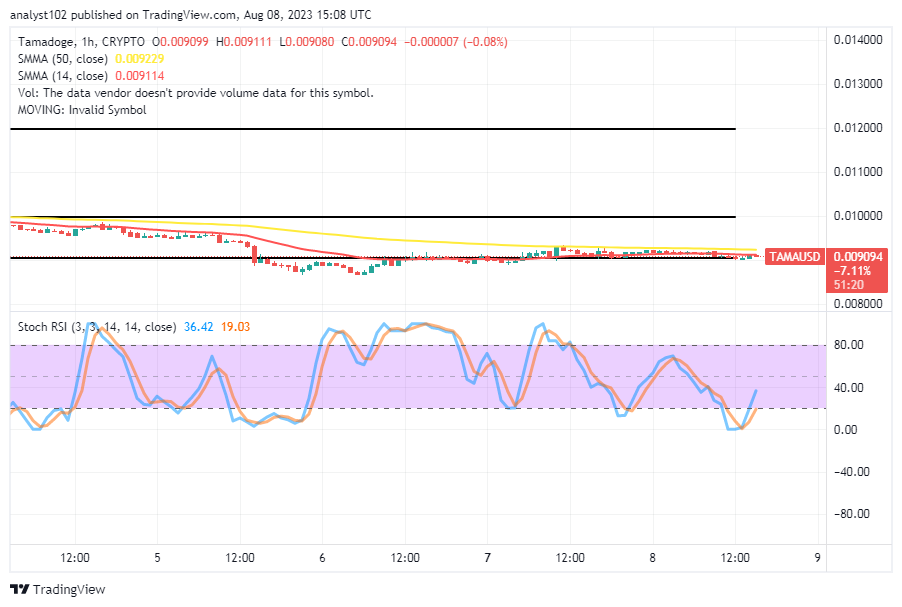
The TAMA/USD short-term chart showcases how the crypto-economic market condenses and tends to blowup around the trade axis of $0.00900.
The 50-day SMA trend line is directly beneath the 14-day SMA trend line. The larger Moving Average shows that the major hurdle is currently $0.009229, which is located just above the price line. The price has considerably challenged some lows around $0.00900, as shown by the Stochastic Oscillators’ zigzag positions. And that shows that, as of the time this technical piece was being put together, a mustering of momentum is still going on.
The day has finally arrived, and we know you’ve been beyond thrilled! Have fun playing!
📣MASSIVE NEWS, TAMA ARMY📣
— TAMADOGE (@Tamadogecoin) August 8, 2023
For Android users, you can now download our latest app, Tamadoge Arena!
We know you’ve been mega excited, and the day has finally arrived! Happy gaming! https://t.co/INCaGendE4
Do you want a coin that would 100X in the next few months? That is Tamadoge. Buy TAMA today
Note: Forexschoolonline.com is not a financial advisor. Do your research before investing your funds in any financial asset or presented product or event. We are not responsible for your investing results.


Leave a Reply