Tamadoge Price Prediction – August 31
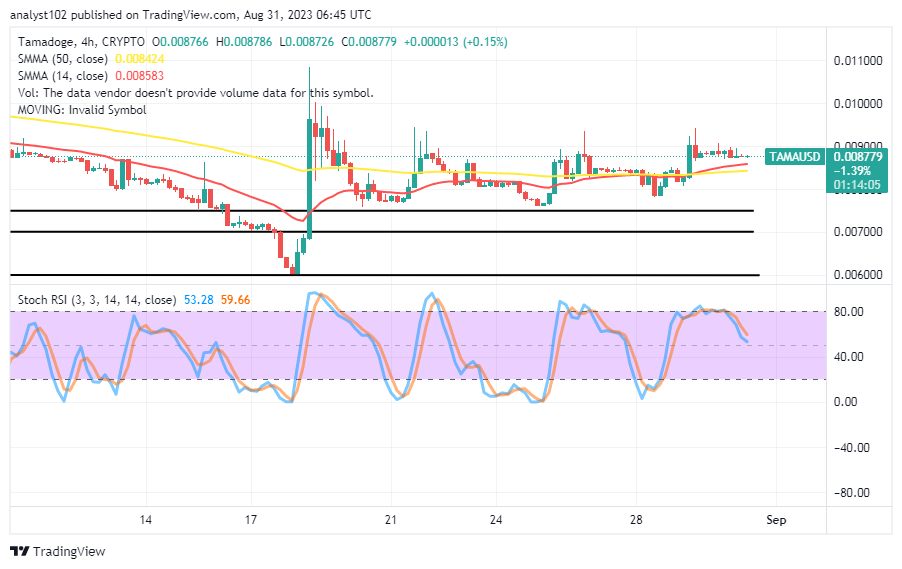
Today’s business environment, as at this technical analysis time, records that the TAMA/USD market bulls are holding firm against the economic values of the US coin, wearing strength at a minute positive percentage rate of 0.15.
Between the high of $0.008786 and the low of $0.008726, buyers and sellers of the paired trade have gravitated in an impulse. Executors of long position orders must actively participate since the price tends to choose a correction as it approaches a buy.
TAMA/USD Market
Key Levels
Resistance levels: $0.009500, $0.01000, $0.01050
Support levels: $0.007500, $0.006500, $0.005500
TAMA/USD Medium-term Chart
The TAMA/USD medium-term chart reveals that the crypto market bulls are on the rise above the support line of $0.007500, wearing strength toward the resistance trade zone of $0.009500.
The 14-day SMA indicator is $0.008583 above the 50-day SMA indicator, which is $0.008424. Trading candlesticks that have formed over the course of a few hours have created a line of rejections near the price of $0.009000. The stochastic oscillators have crossed over to values between 59.66 and 53.28 from the 80 zone.
What criteria are used to decide whether to place a purchase order in the TAMA/USD market?
The ideal psychological tool that is currently ideal for determining decent purchasing orders is the stochastic oscillators when they are at low trading lines in the TAMA/USD market, given that the crypto trade bulls are on, wearing strength toward the resistance line of $0.009500.
During the period when buying and selling activity largely fluctuates between $0.009500 and $0.007500, it would be wise to stage long positions at the lower value and its subsequent lower value. Given the current situation, buying positions at higher prices from the larger point shouldn’t be sold off quickly, especially if they were opened on platforms other than MT4 and its ilk.
TAMA/USD Short-term chart
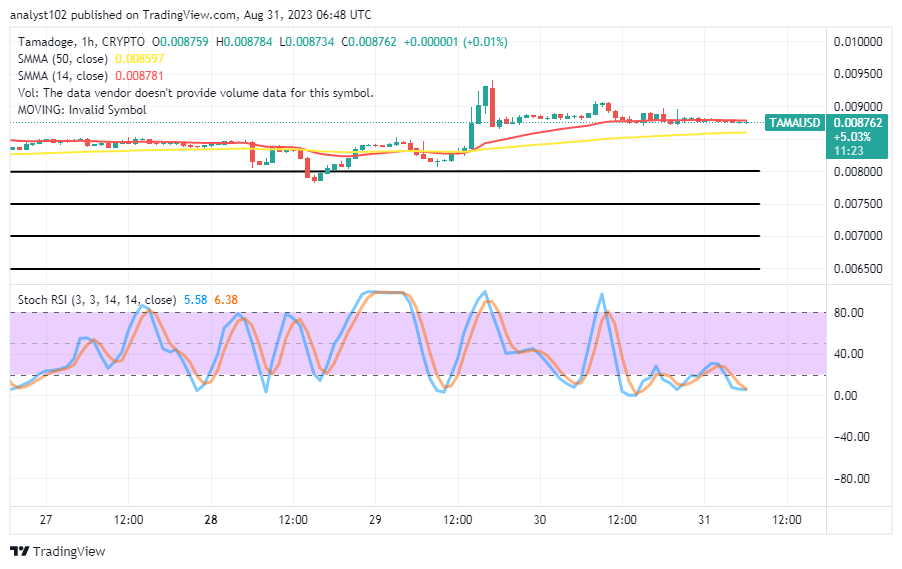
The TAMA/USD short-term chart showcases the crypto market bulls are on for several hours from the base of $0.008000, wearing strength between $0.009000 and $0.009500 points.
The 50-day SMA indicator’s trend line is going above the 14-day SMA indicator’s trend line. Additionally, they are highlighted between $0.008781 and $0.008597. The stochastic oscillators have been moving in an easterly direction between the oversold area and values of 40. Good buying back from the moving averages will be possible in the event of a bearish reversal.
Remember that today is the deadline for this week’s Tamadoge Arena competition leaderboards!
Don’t forget the leaderboards for this weeks Tamadoge Arena contest end tonight!
— TAMADOGE (@Tamadogecoin) August 30, 2023
Play on mobile, rank up those leaderboards and get your share of $TAMA 🤑
📱 Android: https://t.co/INCaGendE4
📱 iOS: https://t.co/Fj9tT5Oicu pic.twitter.com/dePw8apboT
Do you want a coin that would 100X in the next few months? That is Tamadoge. Buy TAMA today
Note:Forexschoolonline.com is not a financial advisor. Do your research before investing your funds in any financial asset or presented product or event. We are not responsible for your investing results.


Leave a Reply