Tamadoge Price Prediction – July 17
As trade activities to give birth to stable upsurges continue to slow in their capacity, the Tamadoge pairing with the market power of the US Dollar also bounces most times, portending spirals.
In the lower $0.002 trading zones, bulls and bears have been engaged in a systematic battle to establish a particular all-time bottom. If a recovery is generated with consistently increasing strength and, in the process, generates a bullish, engulfing candlestick, this might potentially set up the eagerly expected bounce-offs.
TAMA/USD Market
Key Levels
Resistance levels: $0.003, $0.004, $0.005
Support levels: $0.002, $0.0015, $0.001
TAMA/USD Medium-term Chart
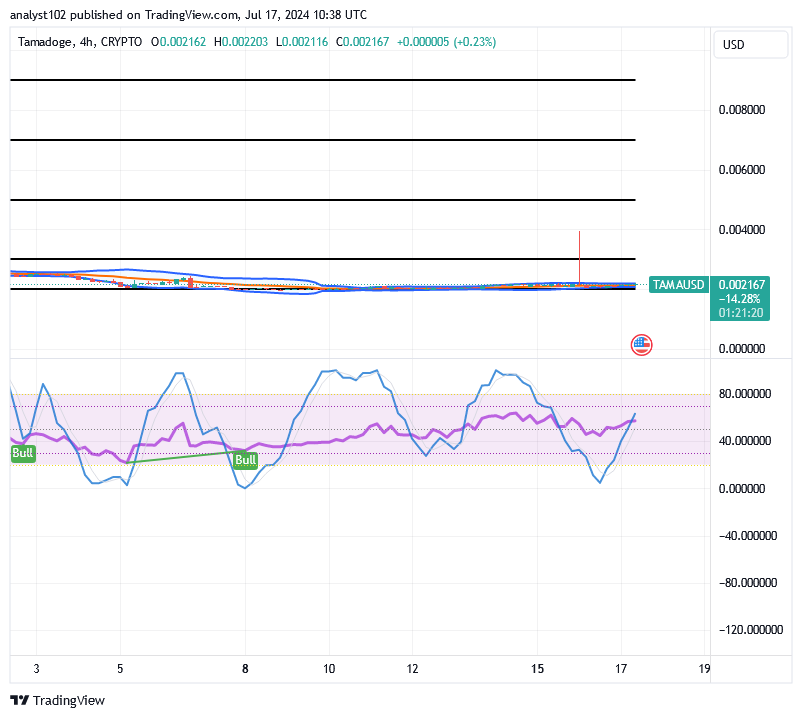
The TAMA/USD medium-term chart shows the crypto-economic market bounces, portending spiraling signs around the zone of $0.002.
In order to demonstrate that the rate of price movement has been slow, variant trade-able candlesticks have been appearing around the $0.002 baseline. The Bollinger Bands have continued to extend eastward, confirming that the trajectory that prices have been on is a flat trend. The stochastic oscillators have continued to veer through the highs and lows at various points, indicating that buyers are attempting to push higher during the majority of the moves.
From $0.002 forward, whatever path may the TAMA/USD market take in accordance with the technical outlook?
As there are swerving modes of the oscillators to denote the movement capacity of the price in the TAMA/USD trade, the next massive directional moves are likely going to the upside, given that the price bounces, portending spiraling moments.
Regardless of how long the TAMA/USD market stays low, trading near $0.002, investors will need to take action to secure further points before the long-term events of the projected steady recovery materialize. Most of the time, it makes no sense to abandon the purchasing and holding trade strategy given the current low points of the developing crypto economy relative to the US dollar.
The TAMA/USD short-term
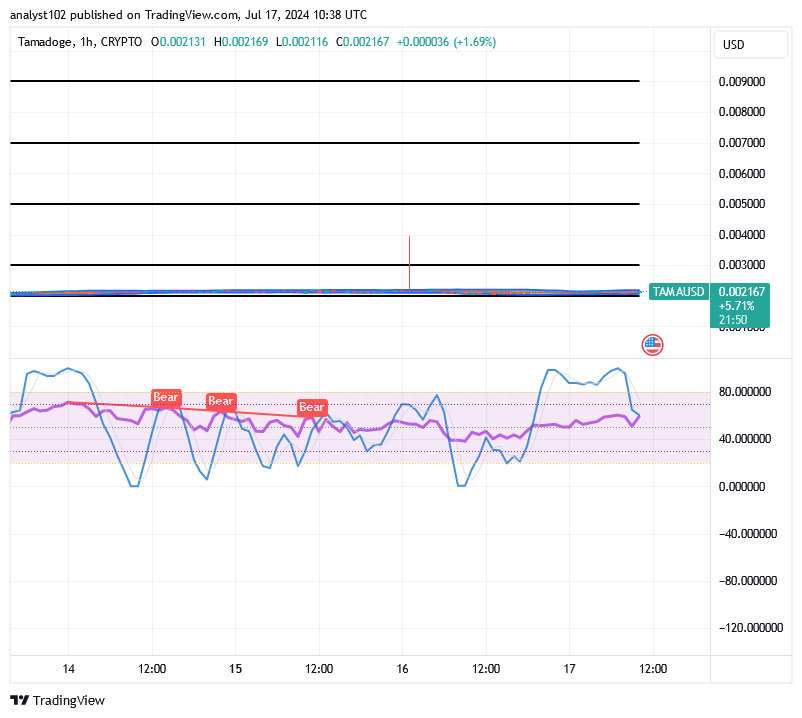
The TAMA/USD short-term chart shows that the crypto-economic market bounces, portending spiraling inputs.
To make a decent start toward obtaining purchasing position orders, the stochastic oscillators have resorted to going higher. Around the $0.002 mark, the Bollinger Bands trend lines are moving in an eastern mode, suggesting that a chain of sideways is also affecting the hourly-formulating chart. Investors ought to continue with purchase orders.
Credits are loading in the Tamaverse!
Enter exciting games like Arcade and Pursuit by using your credits!
Strive for excellence to show off your abilities, move up the leaderboards, and receive TAMA.
Load up with credits in the Tamaverse! 🐶
— TAMADOGE (@Tamadogecoin) July 16, 2024
Use your credits to enter thrilling games like Pursuit and Arcade! 🎮
Compete fiercely to climb the leaderboards, showcase your skills and earn $TAMA🏆
📱 Android: https://t.co/D4TjX7gTFl
📱 iOS: https://t.co/0fjJapf5oA pic.twitter.com/vQByohbGXX
Do you want a coin that would 100X in the next few months? That is Tamadoge. Buy TAMA today
Note: Forexschoolonline.com is a financial advisor. Do your research before investing your funds in any financial asset or presented product or event. We are not responsible for your investing results.


Leave a Reply