Tamadoge Price Prediction – June 7
In the last several hours, running over a day back, the Tamadoge ran a move slightly beneath the $0.01400 line, surrendering to the purchasing power of the US currency before the situation currently changes, given that the crypto-economic market activities are witnessing north swings. The pace of the gravity to the upside appears garnering a weak index to nurture smoothly through the near overhead barriers below the resistance zone of $0.01600. That said, buyers would have to continue with the pre-cautioning attitude of making a comeback. Investors’ stances in this crypto economy shouldn’t be undermined toward succumbing to any unprecedented free fall-offs.
TAMA/USD Market
Key Levels
Resistance levels: $0.01600, $0.01700, $0.01800
Support levels: $0.01400, $0.01300, $0.01200
TAMA/USD – 4-hour Chart
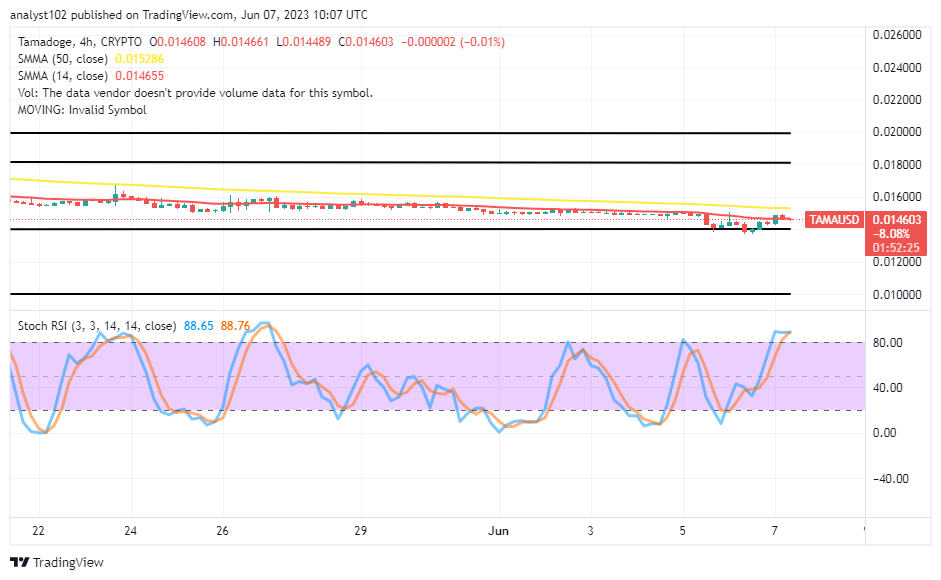
The TAMA/USD 4-hour chart showcases the crypto-economic market activities have witnessed north swings after a brief line of declines to visit an area of $0.01400 support level. The 50-day SMA indicator is at $0.015286 above the $0.014655 value line of the 50-day SMA indicator. The Stochastic Oscillators have penetrated the overbought region, keeping the positions of 88.76 to 88.65 to indicate that a retrace is relatively imminent. 
Will the TAMA/USD market operations remain trading below the sell signal side of the 50-day SMA?
A necessary change to this current manner of ups and downs of the TAMA/USD trade will cease when bullish-engulfing trading candlestick surfaces, coupling it with an interception of the bigger indicator by the smaller indicator to the upside, as the crypto market activities have witnessed north swings from lower-trading supports of the $0.01400. Since the reading of the Stochastic Oscillators indicates an overbought condition to justify the need to wait for re-buying moments, the strength of longing position orders has not yet fully recovered from not returning some spots around the value line. Takers of long positions would have to stick with the notion that they have open positions.
TAMA/USD 1-hour chart
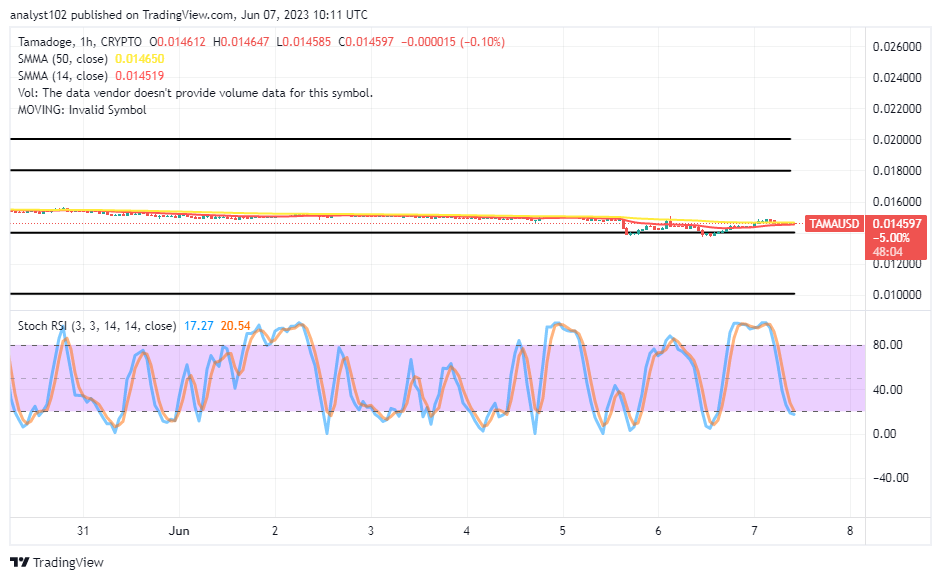
The 1-hour chart depicts that the crypto-economic market activities have witnessed north swings around the trend lines of the SMAs. The 14-day SMA indicator is at $0.014519, seemingly attempting to touch northward against the $0.014650 point of the 50-day SMA indicator. The Stochastic Oscillators have positioned southbound from the oversold region to 20.54 and 17.27 levels. Even with the momentum reversing to the support level at $0.01400 in mind, we think bears won’t be able to stay safely below the trade point for very long.
There is one method we know of to recover from the midweek slump.
You’re halfway through the week, Tama Army 💪
— TAMADOGE (@Tamadogecoin) June 7, 2023
We only know one way to get over the midweek slump… $TAMA #Tamadoge #memecoin pic.twitter.com/ugWhXlWdWT
Do you want a coin that would 100X in the next few months? That is Tamadoge. Buy TAMA today
Note: Forexschoolonline.com is not a financial advisor. Do your research before investing your funds in any financial asset or presented product or event. We are not responsible for your investing results.


Leave a Reply