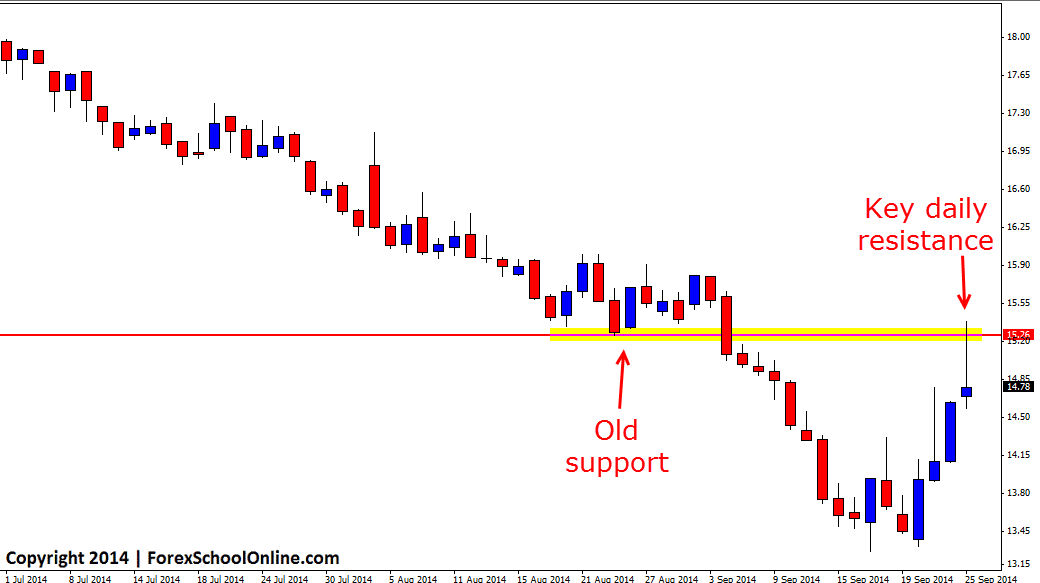
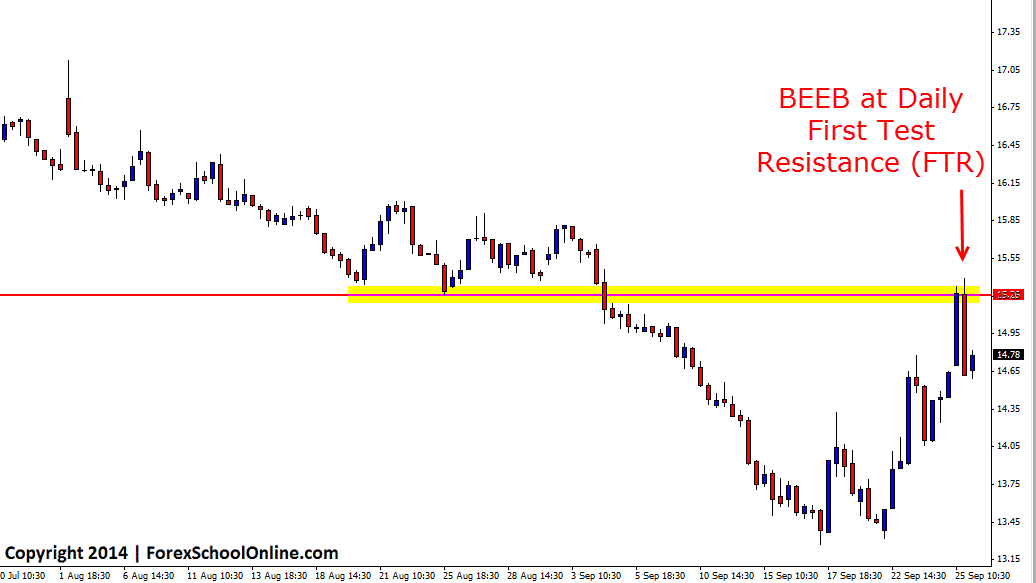
Price action on the 4hr chart of the Sugar market has fired off a 4 hour Bearish Engulfing Bar (BEEB). Price has started a retrace back higher on the 4 hour chart with price moving back into the key resistance level. As the daily chart shows below; price has now moved into the key daily resistance area that was recently an old support level. This level is looking to become a price flip level and new resistance if price can hold and stay below.
Price on the 4 hour chart moved back higher after forming a base and double low as shown on the 4 hour chart below. After moving higher price is now making a first test of resistance with this bearish engulfing bar. To have any chance of making a move back lower price will need to confirm the engulfing bar and break the BEEB’s lows. If price can make a break of the lows, the next support level comes in around the 14.05 level.
If traders zoom out their chart they will be able to see that the Bearish Engulfing Bar has a support level that it is sitting on, so if price cannot break lower and price does move back higher, the next major resistance is obviously the key daily resistance. If this then breaks it could look to become a price flip level once again and once again become a new support level.
NEW TRADING LESSON! I have just released a new trading lesson that is all about helping you to read the live price action order flow as it is printed onto the chart and learning to build an edge through price action trading. You can read this new trading lesson here: To be a Successful Price Action Trader, Don’t Follow the News
Sugar Daily Chart

Sugar 4 Hour Chart


Hi Johnathon, in which platform can i see sugar ?
Thanks
Hello Luca,
HotForex carries a few of the different markets such as Sugar and platinum etc
Johnathon