Sponge is facing resistance levels at $0.000196 and $0.000330
SPONGEUSDT Price Analysis – 21 August
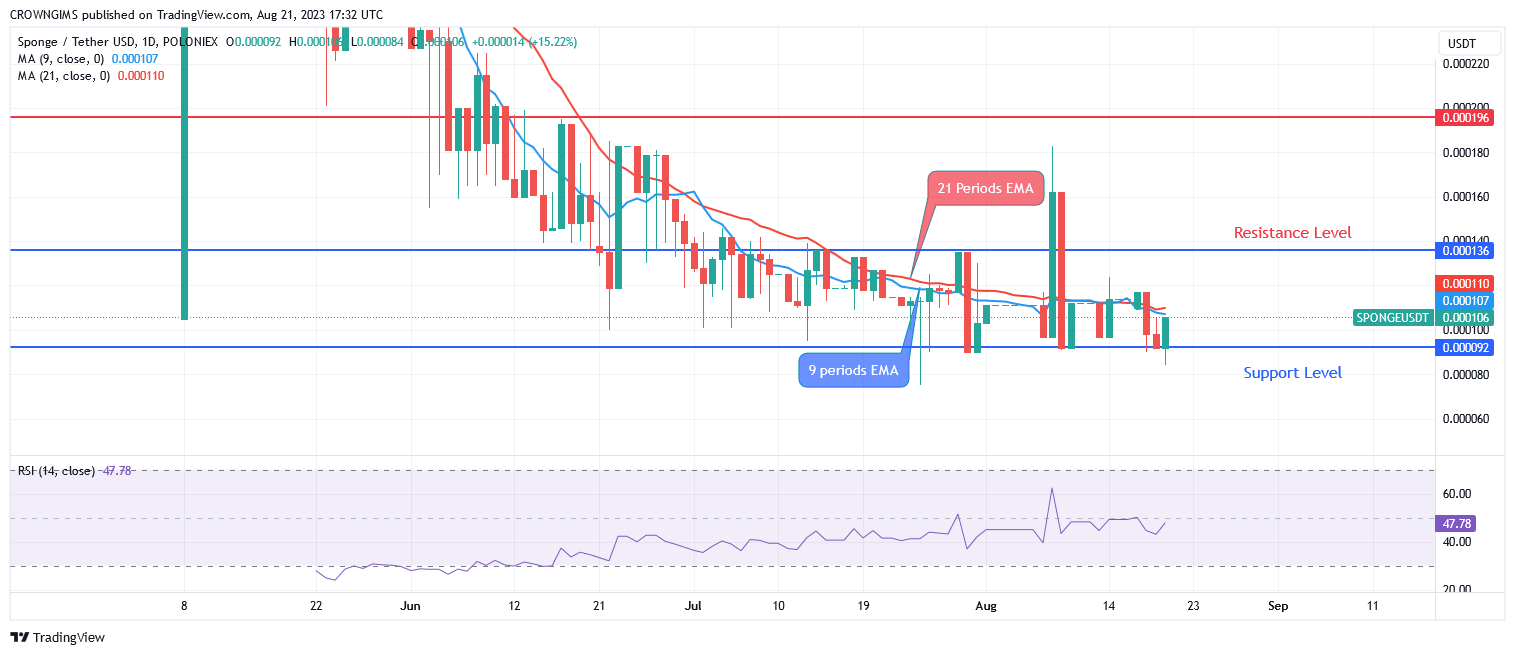
Bullish movement may continue as long as the bulls maintain their pressure, the price level of $0.000136 may be penetrated, and Sponge may face the resistance levels at $0.000196 and $0.000330. In case the resistance level of $0.000136 holds, bears may find support levels at $0.000093, $0.000004 and $0.000006.
Key Levels:
Supply level: $0.000136, $0.000196, $0.000330
Demand level: $0.000093, $0.000004, $0.000006
SPONGEUSDT Long-term Trend: Bullish
SPONGEUSDT is bullish on the daily chart. The bullish trend that commenced on August 08 has pushed the price to the high of $0.000196 after breaking up $0.000136 level. The mentioned level was defended by the bears with the formation of a bearish harami candle. More bearish candles were produced and the Sponge commences a bearish movement. Bulls are currently defending the support level of $0.000093, there is a tendency for the bulls to dominate the market.

The buyers are trying to dominate the SPONGE market. The fast Moving Average (9 periods) is bending towards the slow Moving Average (21 periods EMA) and the price is trading above the slow EMAs which indicates a bullish movement. Bullish movement may continue as long as the bulls maintain their pressure, the price level of $0.000136 may be penetrated, and the price may face resistance levels at $0.000196 and $0.000330. In case the resistance level of $0.000136 holds, bears may find support levels at $0.000093, $0.000004, and $0.000006.
SPONGEUSDT medium-term Trend: Bullish
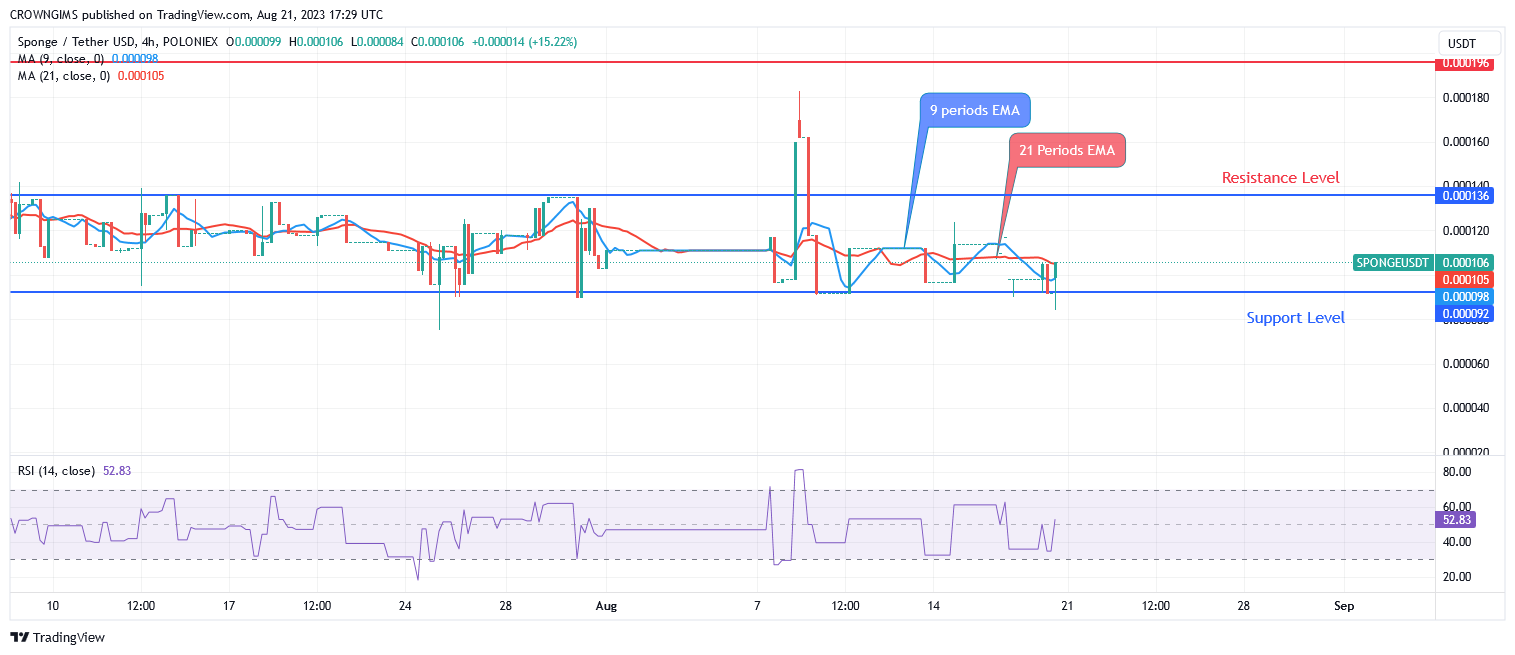
SPONGEUSDT is bullish in the 4-hour chart. The buyers dominated the Sponge market last week. The bullish trend continued as the bulls were steadily gaining more pressure. The resistance level of $0.00036 was tested, the mentioned level holds. The bulls were able to gain more pressure and the price is inclining towards the north at the moment.

The fast EMAs is crossing the slow EMA upside and the currency pair is trading above the 9 periods EMA and 21 periods EMA which indicates a bullish market. The relative strength index period 14 is at 47 levels and the signal lines bend up to indicate buy signal.
Never try to resist the cryptocurrency market.
You can never resist the #Crypto market…🌐🤣 pic.twitter.com/DNw4GeyLDi
— $SPONGE (@spongeoneth) August 21, 2023
Invest in the hottest and best meme coin? Buy Sponge ($SPONGE) today!


Leave a Reply